

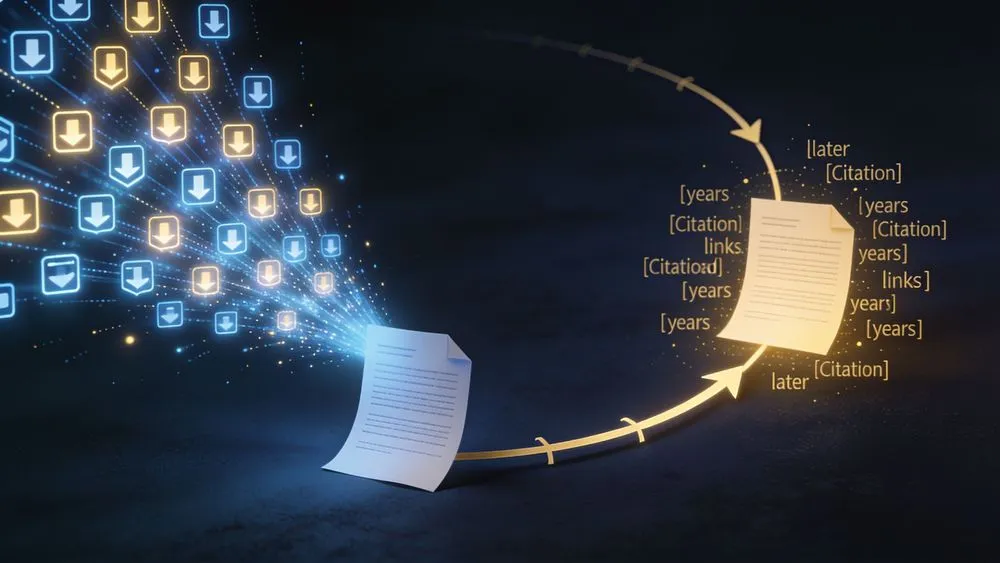
For over half a century, academia has relied on the same method to measure how much a paper has contributed to science: the number of times other researchers cite it as a reference—its citation count.
This system traces its origins back to 1955, when information scientist Eugene Garfield published his concept of a citation index in the journal Science, which he later realized in 1964 as the Science Citation Index (SCI). Garfield's original goal was to improve the efficiency of literature search, but the "impact factor" that emerged as a byproduct of SCI rapidly spread as a metric for evaluating journals and researchers. Since Journal Citation Reports officially launched in 1975, citation counts have become the de facto currency of scientific evaluation.
However, this currency has a structural flaw. The path from a paper being read to being cited requires a long chain of events: readers must understand its content, incorporate it into their own research, write their own paper, and get it through peer review and publication. As Cornell University information scientist Yian Yin puts it, "Most papers get read within a day or two of being posted, but citations don't start accumulating for three years, sometimes longer."
The Trace of "Being Read" Arrives First
Attempts to compensate for the delay in citation counts have existed for some time. In 2010, Jason Priem and colleagues published the "altmetrics manifesto," proposing metrics such as Twitter mentions, Mendeley saves, and download counts as evaluation measures. Research demonstrating a correlation between download counts and citation counts has also accumulated over the years. One prior study reported a ratio of roughly one citation per 100 downloads for papers in the journal Tetrahedron Letters. A study using Mendeley reader counts found that papers that gained readers within six months of publication had approximately 34.7% more citations five years later compared to papers that did not.
But these studies shared common limitations: the data was either small in scale, restricted to specific journals or fields, or unable to rigorously trace the temporal sequence between downloads and citations. There was no standard dataset that could test the intuitively plausible hypothesis that "downloads precede citations" at a scale of millions of papers with fine time resolution.
A New Problem Formulation: "Lead-Lag Forecasting"
A team led by Yian Yin and Sarah Dean at Cornell University's Ann S. Bowers College of Computing and Information Science took an approach to fill this gap. Rather than inventing a new prediction method, they first formalized the problem itself: "Lead-Lag Forecasting" (LLF).
The definition is straightforward: predict a delayed channel of impact (the "lag") from an early channel of engagement (the "lead"). For arXiv, the lead is download counts and the lag is citation counts. For GitHub, the lead is pushes or stars, and the lag is fork counts.
With arXiv's cooperation, the team obtained anonymized access logs accumulated since July 2006. The raw download count reached 4.87 billion events. After identifying and removing approximately 44% as bot traffic, they constructed per-paper access time series for about 2.3 million papers. They then cross-referenced this with data from Semantic Scholar (approximately 220 million papers, approximately 2.66 billion citation relationships) to estimate citation time series for each paper. In the end, approximately 2 million papers with both access and citation time series became the subject of analysis.
On the GitHub side, the team combined event data from GH Archive with package metadata from Ecosyste.ms, constructing push, star, and fork time series for approximately 3 million repositories.
Can 30 Days of Data Predict a "Hit" Five Years Later?
The dataset's validation results clearly demonstrated the existence of a lead-lag structure. Across the entire arXiv corpus, the first access invariably occurs before the first citation. The Pearson correlation between access counts and citation counts five years later rises immediately after publication and strengthens with each passing day. In contrast, the correlation between early citation counts and citations five years later doesn't surpass that of access counts until roughly 50 days after publication.
When quantified as a prediction task, this structure becomes even clearer. The team set up a binary classification problem: "Can papers that will reach 50 or more citations within five years (the top 8.1%) be identified using only early-stage data?"
| Observation Window | Features | AUC (Download → Citation) | F1 Score | Random Baseline AUC |
|---|---|---|---|---|
| 30 days | Cumulative downloads only | 0.80 | 0.31 | 0.50 |
| 100 days | Cumulative downloads only | 0.83 | 0.35 | 0.50 |
| 365 days | Cumulative downloads only | 0.86 | 0.39 | 0.50 |
| 365 days | Time-MoE embeddings + logistic regression | 0.88 | 0.39 | 0.50 |
With just 30 days—one month—of download data after publication, the model reaches an AUC of 0.80. This is substantially better than random selection (0.50), showing that "highly cited papers" five years out can be ranked with considerable accuracy. Using embedding features from the time series foundation model Time-MoE improves the AUC to 0.88 at 365 days.
A similar pattern was confirmed on the GitHub side. Early star counts showed the strongest correlation with fork counts five years later—even stronger than early fork counts themselves. The median repository gets its first star within 10 to 30 days of publication, whereas its first fork doesn't occur until 100 to 200 days later.
Why Are Downloads "Faster" Than Citations?
Behind this asymmetry lies a staged structure in how scientific information is processed. Reading a paper is the first step in determining whether its content is relevant to one's own research. Citation, on the other hand, sits at the final stage of a much longer process: incorporating what was read into one's own research, writing a paper, and getting it through peer review and publication. A download is an "expression of interest," while a citation is the "outcome of that interest." The time gap between the two produces the lead-lag structure.
Yin describes this as "something like a prediction market"—except that scientists are casting their "votes" with attention rather than money. The act of someone downloading a paper is an aggregation of a collective prediction that the paper will become important in the future.
What the Dataset Opens Up—and What Remains Unseen
The contribution of this research lies less in the prediction accuracy itself than in the formulation of the problem and the provision of a data infrastructure. Within the time series forecasting community, lead-lag forecasting has never been treated as a unified problem, largely because no standard benchmark dataset existed. This dataset provides a split of 938,000 papers for training, 235,000 for validation, and 235,000 for testing, establishing an environment where subsequent research can conduct reproducible comparisons.
However, many questions remain unresolved. First, there's the fact that F1 scores remain in the range of 0.31 to 0.39. Even though the AUC is high, the balance between precision and recall when actually applying a threshold to classify papers as "highly cited" remains rough. Second, this dataset alone cannot determine whether the relationship between downloads and citations is causal or merely correlational. The possibility of a common cause—that excellent papers are both downloaded and cited more—has not been ruled out. Third, arXiv is a preprint server skewed toward physics, mathematics, and computer science, and generalization to biomedicine or the social sciences has not been verified. Fourth, how much the accuracy of bot removal (approximately 44% removed) affects the results remains a matter for sensitivity analysis.
Regarding potential applications, Yin states: "During COVID, economists estimated that advancing a solution by even a single day was worth tens of billions of dollars. Whoever can sense where the frontier is moving next—even by just a few days ahead—gains a competitive edge, whether that's a company, a funding agency, or a nation." If download logs serve as a mirror reflecting the future of science, then improving the resolution of that mirror will be the next challenge.