

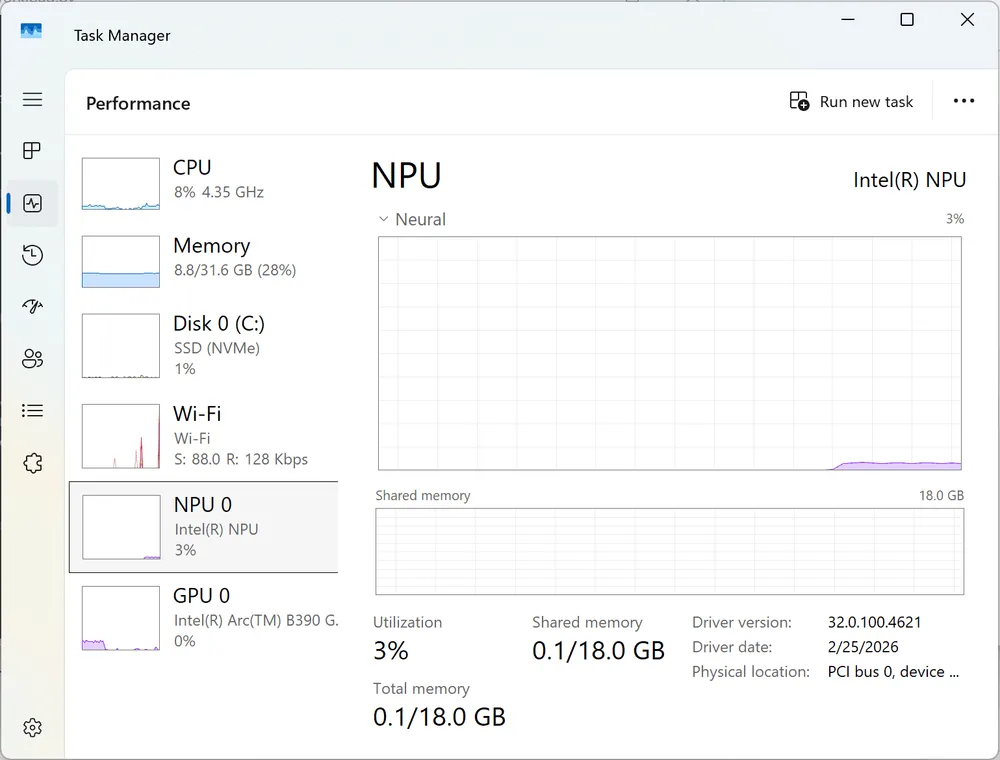
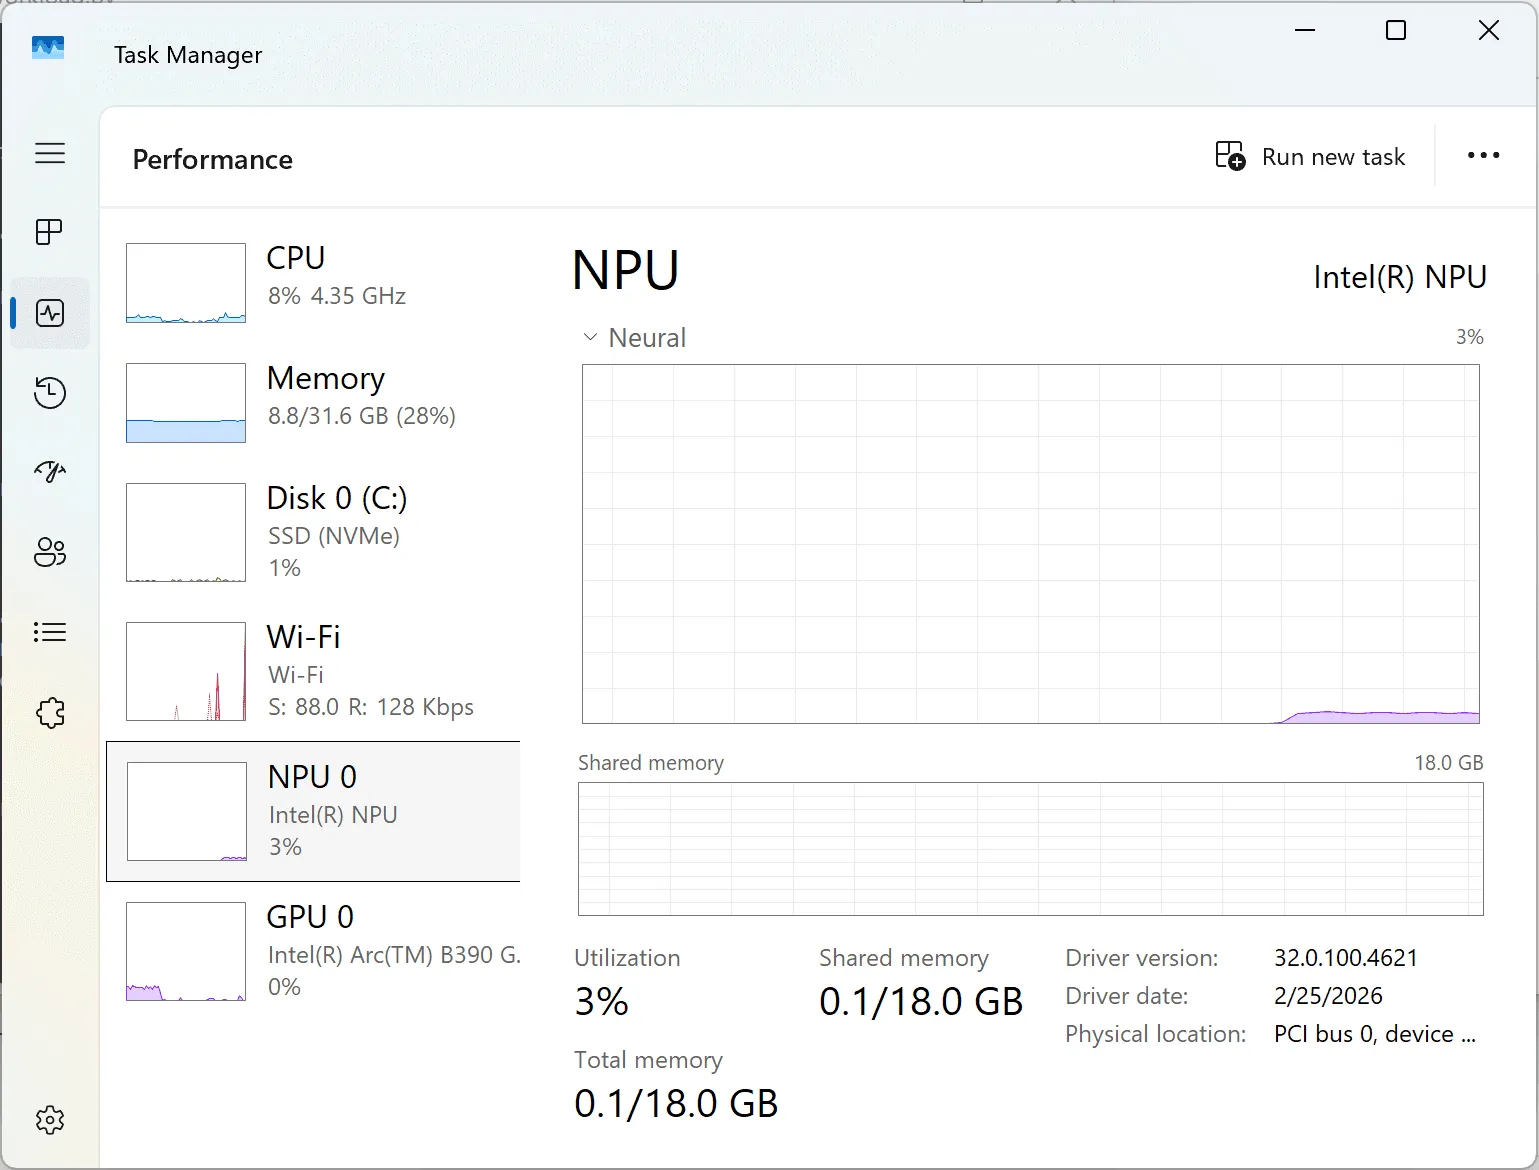
Microsoft has made it possible to track NPU (Neural Processing Unit) load down to the process, user, and details level in Windows 11's Task Manager. This moves beyond the previous stage of viewing overall device usage on the Performance page, to the stage of investigating which app is using which internal NPU engine. The feature was documented in the preview update for Windows 11 24H2/25H2 dated May 26, 2026, and was also included in the cumulative update on June 9. The coverage by Neowin on August 20 was not about a new feature implemented on that date. The focus here is on how standard tools can help clarify which computing resource is handling AI workloads.
Tracking the source of load with four NPU columns
What's been added this time are the NPU and NPU Engine columns, selectable in Processes, Users, and Details on target PCs equipped with an NPU. The NPU column shows the current percentage of activity per process or user, while the NPU Engine column provides a clue as to which execution engine is running within that same NPU. In Details, NPU Dedicated Memory and NPU Shared Memory can also be selected. As a result, Details can display four types of information side by side for each process: NPU load, execution engine, dedicated memory, and shared memory.
To add these displays, right-click the column header on each page (or long-press for touch input) and select the relevant column from the menu. This information doesn't appear just by looking at the default screen—when trying to identify the cause of load, you need to explicitly add columns. A display that simply shows total usage has gone up doesn't tell you whether a background meeting effect, search/image processing, or local inference was responsible. The per-process columns bring that question back to app names and usernames.
Microsoft states that seeing which app or user is using how much NPU, and which engine is running, makes it easier to identify loads that affect performance or battery life. They also mention this can be used to verify whether efficient AI hardware is actually being utilized. Utilization is not a benchmark that directly measures theoretical performance or a model's processing speed. Even so, as an initial screen for tracking down the source of processing, it offers more information than an overall device meter.
An Isolation column has also been added to Processes and Details. This column identifies apps running within an AppContainer and is not a performance metric. It doesn't automatically decide whether a high-load process can be safely terminated, but it serves as supplementary material for understanding the execution boundary and role of the process generating the load.
Neural engines within the GPU now on the same screen
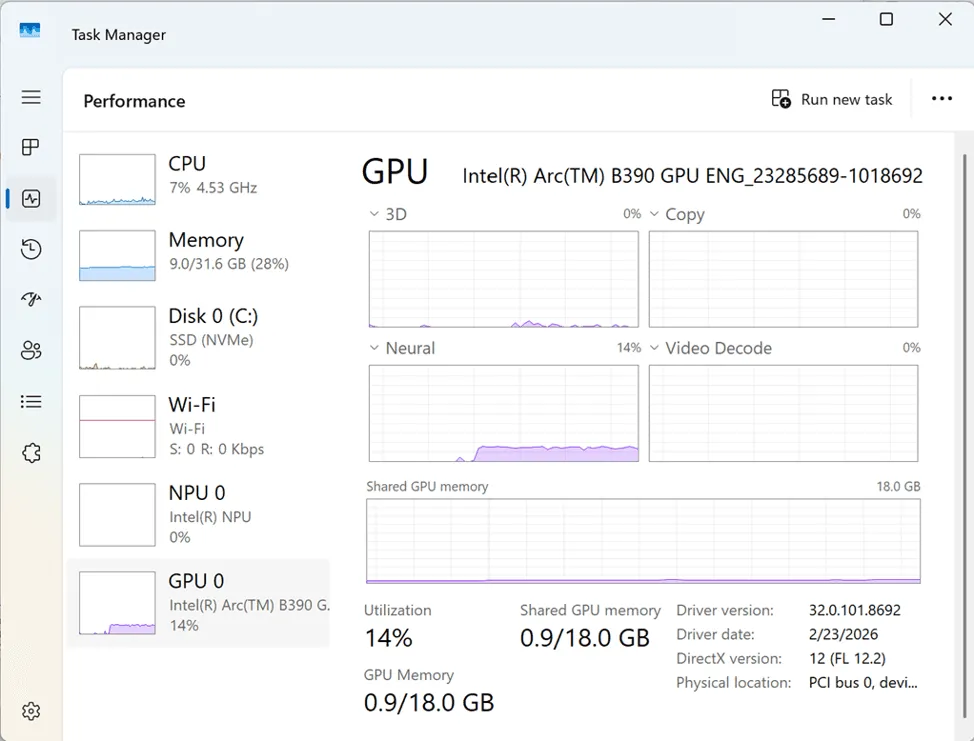
Microsoft has also made the neural engine within the GPU visible on the Performance page, and updated the existing GPU Engine column to indicate neural workloads as well. This allows dedicated NPU usage and AI processing on the GPU side to be distinguished within the same diagnostic pathway in Task Manager. When an app launches AI processing, there's now an entry point to determine whether it ran on the dedicated NPU or was loaded onto the GPU's neural engine.
Behind this lies Microsoft's approach to computing resources under MCDM (Microsoft Compute Driver Model). MCDM handles GPUs, NPUs, and other resources within a common driver framework, linking computational work submitted by apps to contexts, software queues, and engines. The OS-side scheduler adjusts execution according to fairness and priority. While Task Manager's display doesn't explain the entire execution path, it connects to a mechanism that treats even dedicated compute devices as work managed by the OS.
What matters here isn't the label itself—whether it's called NPU or GPU. What matters is whether a workload implemented for the NPU is reaching the intended computing resource, or falling back to the CPU or GPU. Opening the NPU column, NPU Engine column, and GPU Engine column simultaneously makes it easier to catch the moment when load shifts, right from the start. That said, the amount of information that appears in Task Manager depends on the OS version, the target hardware, and the capabilities exposed by the driver and implementation.
Don't confuse utilization with actual performance
High NPU utilization alone doesn't mean an app is behaving abnormally. It's possible that the target process was implemented for the NPU and is continuously submitting work. Conversely, even if the display shows zero, that doesn't immediately indicate NPU incompatibility. You need to check together whether the driver recognizes the NPU, whether the workload's implementation is designed to be assigned to the NPU, and whether it's falling back to the CPU or GPU.
NPU Engine is a clue for knowing which execution engine within the same NPU is running. Meanwhile, the utilization figure in the NPU column represents the current activity percentage—it's not a number that represents catalog theoretical performance or the processing speed of a specific model. Confusing these two risks translating fluctuations in utilization into performance comparisons. The observation of which engine an app used, and the evaluation of how many seconds the same process took to complete, need to be treated separately.
Even in battery life investigations, the meaning of these columns is limited. Microsoft states that viewing NPU consumption and the execution engine helps identify loads affecting battery life, but the newly added columns don't measure power consumption itself. After confirming high NPU utilization in Task Manager, you identify which app is maintaining that state. The app name, engine name, and execution conditions obtained there then flow into performance and battery-life verification.
The boundaries of temperature, voltage, and long-duration logging
This time, Task Manager has strengthened real-time initial diagnostics. However, temperature, voltage, and fan speed have not been added. Throttling reasons and long-duration logging haven't been added either. Investigations requiring sensor values or logging remain in the domain of sensor tools like HWiNFO, or Windows Performance Recorder/Analyzer. The NPU columns don't replace these—they're a display for narrowing down which process and engine to track before diving into detailed analysis.
Task Manager also added GPU temperature display back in 2019, but at the time Microsoft required a dedicated GPU and drivers supporting WDDM 2.4 or later. From the precedent of GPU temperature becoming visible, you can't generalize that CPU temperature and all sensors are equally visible on the same screen. This new NPU monitoring should likewise not be read separately from the conditions of supported hardware and software.
The same caution applies to the Isolation column. AppContainer is a minimal-privilege execution environment, but the mere presence or absence of this column doesn't determine an app's safety. It should be used as material for understanding which execution boundary an app generating NPU load resides in, while conclusions about security status need to be confirmed through other information.
The OS, hardware, and driver determine the display scope
This applies to compatible devices that have installed the June non-security update or later. For Windows 11 24H2/25H2, the KB5089573 preview update was released as OS Build 26100.8524/26200.8524 on May 26, 2026, and KB5094126 on June 9, 2026 incorporated these non-security improvements. Therefore, this enhanced NPU monitoring is not a future feature for Insiders. It's consistent with the timeline to confirm this as a feature available in supported environments from June onward.
However, simply installing the update doesn't guarantee that every PC will return the same columns and values. The display scope varies depending on whether an NPU is present, whether a neural engine is implemented within the GPU, and what capabilities the driver exposes. If NPU utilization isn't visible, first check separately the OS version and update history, the target hardware, and the driver's recognition status. This is necessary to distinguish between the feature's absence and a state where the workload simply isn't using that engine.
Practical verification begins by recording how the NPU column, NPU Engine column, and GPU Engine column change under the same app, same process, and same OS build conditions. Furthermore, unless you align whether the app's implementation actually uses the NPU and what capabilities the driver reports, you can't connect differences in display to differences in performance. The next point to confirm is whether, on compatible PCs with updates from June 2026 onward installed, these columns show consistent values against actual workloads.