

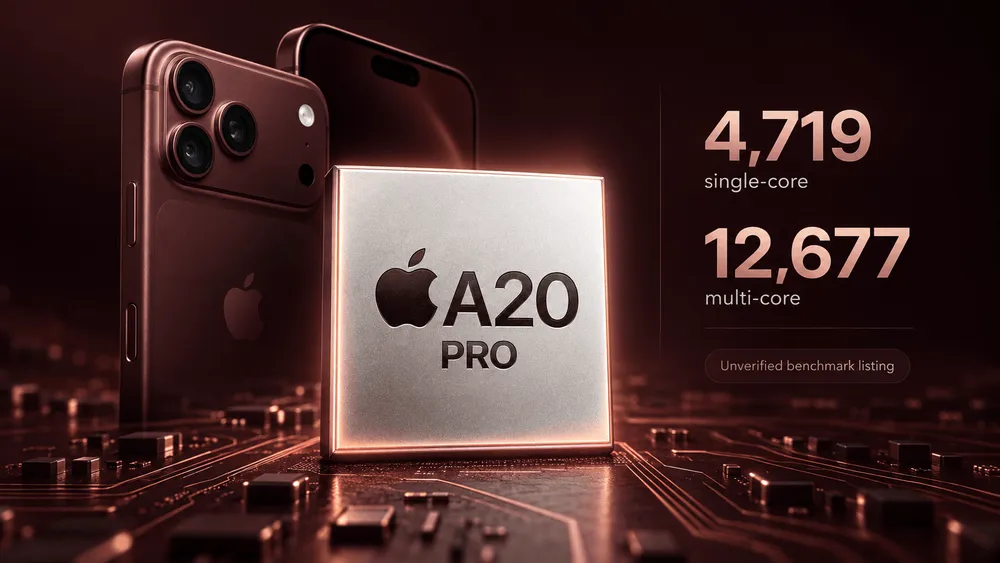
A benchmark result for a device believed to be powered by Apple's A20 Pro has appeared on Geekbench Browser. The entry, dated September 10, 2026, shows 4,719 points in single-core and 12,677 points in multi-core, offering a glimpse of the CPU performance of the newly announced chip. The scores are higher than sample listings for the previous-generation A19 Pro and for Android flagships already on sale, but it has not been confirmed whether the result comes from a retail unit. Widen the comparison to sample results for the M5-powered MacBook Air and iPad Pro, and the rankings flip between single-core and multi-core. Here is how far smartphone CPUs have come, based on the test conditions and the per-workload breakdown.
iPhone19,2 Records 4,719 Points
The device name in this listing is "iPhone19,2," with the motherboard name "V63AP." It ran the Geekbench 6.7.0 CPU test on iOS 27.0. The CPU has six cores, split into a group of two and a group of four, with the frequency field showing 4.93GHz and the memory field showing 11.27GB.
The A20 Pro that Apple announced also has a six-core CPU. However, the CPU name in the listing is "ARM," not explicitly "A20 Pro." Nor should we conclude from the device identifier whether it is the iPhone 18 Pro or the Pro Max. What we can confirm is that a record with this configuration and these scores has been made public.
We also don't know who submitted it, the condition of the device, the room temperature, or whether external cooling was used. The 11.27GB memory figure shouldn't be treated as the product's nominal capacity either. Even so, it is concrete material for assessing pre-release CPU performance, because it lets us set an absolute score, with caveats, against the performance gains Apple has announced.
The Gap With the A19 Pro Depends on Which Record You Use
A September 9 listing for the iPhone 17 Pro, which uses the A19 Pro, scored 3,763 in single-core and 9,637 in multi-core. The new record is 25.4% and 31.5% higher, respectively, than this comparison sample. The Geekbench version and OS shown match those of the previous generation, and the gap raises expectations for a performance improvement.
However, another A19 Pro listing, dated September 7, shows 4,053 and 10,532 points. Using that as the baseline, the gaps shrink to 16.4% and 20.4%. How much the A20 Pro improves on the A19 Pro changes depending on which measurement you use as the denominator.
| Chip / device sample | Listing date | Geekbench / OS | Single-core | Multi-core |
|---|---|---|---|---|
| iPhone19,2, believed to have the A20 Pro | Sep 10 | 6.7.0 / iOS 27.0 | 4,719 | 12,677 |
| A19 Pro / iPhone 17 Pro | Sep 9 | 6.7.0 / iOS 27.0 | 3,763 | 9,637 |
| A19 Pro / another iPhone 17 Pro listing | Sep 7 | 6.7.0 / iOS 27.0 | 4,053 | 10,532 |
| A18 Pro / iPhone 16 Pro | Sep 9 | 6.7.0 / iOS 27.0 | 3,496 | 8,841 |
| Snapdragon 8 Elite Gen 5 for Galaxy / Galaxy S26 Ultra | Sep 5 | 6.7.1 / Android 16 | 3,660 | 11,086 |
| Dimensity 9500 / vivo X300 Pro | Sep 8 | 6.7.1 / Android 16 | 3,392 | 10,582 |
Scores are in points. Figures are from individual public listings checked on September 10, 2026. Comparison samples were chosen from records dated September 5–10 for which the version and OS could be confirmed; they are not averages or maximums across all listings. Dates follow what each page displays. Differences are calculated as (this score ÷ comparison score − 1) × 100 and rounded to one decimal place. This is not a test with cooling and power settings standardized across devices.
The comparison is aligned on Geekbench 6.7 versions. However, differences between iOS and Android, as well as the condition of each device, are not equalized.
Against the A18 Pro sample, the new record is 35.0% higher in single-core and 43.4% higher in multi-core. For people using a device from two generations ago, these are numbers that suggest a difference when the CPU is under heavy load. But it is too early to assume everyday screen operations will be faster by the same proportion. In situations where waiting time depends on networking, storage, or app-side processing, the CPU score gap doesn't show up directly.
On the Android side, the new record is 28.9% higher in single-core and 14.4% higher in multi-core than the Galaxy S26 Ultra sample, which uses the Snapdragon 8 Elite Gen 5 for Galaxy. Against the vivo X300 Pro with the Dimensity 9500, it is 39.1% and 19.8% higher. In the records chosen here, the lead over rivals is larger in single-core than in multi-core.
Compared With the M5 MacBook Air and iPad Pro
Place it next to sample results for the M5-powered MacBook Air and iPad Pro, and the rankings flip between single-core and multi-core. This iPhone19,2 beats both models' listings in single-core and falls below them in multi-core.
Scores are in points. All are individual listings from September 2026, not product-wide averages. The iPad's OS field uses the "iOS" label shown in the listing. Geekbench is the same 6.7 series, but this is not a test with OS and cooling conditions standardized.
データを表で見る
| Single-core (points) | |
|---|---|
| iPhone19,2 (presumed A20 Pro) | 4,719 |
| A19 Pro / iPhone 17 Pro (Sep 9) | 3,763 |
| A19 Pro / iPhone 17 Pro (Sep 7) | 4,053 |
| A18 Pro / iPhone 16 Pro | 3,496 |
| Galaxy S26 Ultra | 3,660 |
| vivo X300 Pro | 3,392 |
| M5 / MacBook Air (10 cores) | 4,124 |
| M5 / iPad Pro (9 cores) | 4,167 |
In single-core, this iPhone19,2 exceeds the comparison samples for the previous generation, the Android flagships, and the M5 devices.
データを表で見る
| Multi-core (points) | |
|---|---|
| iPhone19,2 (presumed A20 Pro) | 12,677 |
| A19 Pro / iPhone 17 Pro (Sep 9) | 9,637 |
| A19 Pro / iPhone 17 Pro (Sep 7) | 10,532 |
| A18 Pro / iPhone 16 Pro | 8,841 |
| Galaxy S26 Ultra | 11,086 |
| vivo X300 Pro | 10,582 |
| M5 / MacBook Air (10 cores) | 17,016 |
| M5 / iPad Pro (9 cores) | 16,006 |
Using each M5 device's score as the denominator, the new record is 14.4% higher in single-core and 25.5% lower in multi-core than the MacBook Air. Against the iPad Pro, it is 13.2% higher in single-core and 20.8% lower in multi-core. Among smartphones it led on both scores, but widen the scope to Macs and iPads and a gap remains in workloads that use all cores.
The CPU core configurations are 2+4 for the iPhone19,2, 4+6 for the MacBook Air, and 3+6 for the iPad Pro. Even with the same M5, the MacBook Air and iPad Pro compared here differ in core count. The multi-core gap can't be explained by core count alone, but unless the configuration is matched as well as the chip name, the reading of the performance gap changes.
The speed of tasks run on a single core and the speed of finishing work across multiple cores need to be viewed separately. This record shows that the device believed to carry the A20 Pro exceeds the M5 sample results in single-core but does not reach them in multi-core. It is not a test that ran the same apps under the same conditions as on a Mac or iPad, and there is no power consumption measurement, so it cannot rank overall device work speed or power efficiency.
Winning the Overall Score Doesn't Mean Winning Every Workload
Looking at the breakdown of the multi-core comparison with the Galaxy S26 Ultra, there are workloads where the ranking reverses. This iPhone19,2 posted high values in photo filters and object detection, but fell below the Galaxy sample in Clang, which compiles programs, and in CPU ray tracing.
| Multi-core individual test | iPhone19,2 (presumed A20 Pro) | Galaxy S26 Ultra |
|---|---|---|
| Photo Filter | 15,294 | 10,693 |
| Object Detection | 14,305 | 11,712 |
| Compile (Clang) | 17,279 | 17,378 |
| CPU ray tracing (Ray Tracer) | 13,005 | 14,428 |
The source is the "Multi-Core Performance" section of the same iPhone19,2 listing and Galaxy S26 Ultra listing as in the tables above. The comparison conditions are the same, and the figures are scores for each test, in points.
Even though the overall multi-core score is 14.4% higher, not every workload is 14.4% faster. People who rely heavily on photo filter processing and people who keep running other kinds of computation may benefit differently from CPU advances. Moreover, these are workloads defined by Geekbench, not results that directly measure the speed of a photo app as a whole or a real development environment.
According to Primate Labs' technical document, Geekbench 6's multi-core tests take an approach in which multiple cores share one large job. Because processing that requires cores to communicate with each other is also needed, scores do not grow in step with the number of added cores. When comparing the six cores believed to be in the A20 Pro with the eight cores of the two rivals, superiority can't be decided from core count alone.
Also, even though a test is named object detection, what is measured here is CPU-side processing. It is not an evaluation of the Neural Engine, the dedicated AI circuitry, and the ray tracing item does not represent GPU rendering performance. If you are upgrading for gaming or on-device AI, you will need tests with the corresponding real apps.
Verifying Clock and Cooling Gains on Retail Units After Launch
The iPhone19,2's frequency field is 4.93GHz, 15.7% higher than the 4.26GHz of the A19 Pro compared. The L2 cache field also shows 8.00MB, against 6.00MB for the A19 Pro. The CPU core count remains six for both, but the record shows changes in frequency and cache.
The frequency gap is a comparison of displayed values, calculated as (4.93 ÷ 4.26 − 1) × 100, and does not show that the chip ran at that frequency throughout the test. Cache is memory the CPU uses to keep data close at hand, but the displayed capacity alone doesn't tell us which workloads it helped, or by how much. The score increase this time can't be divided among clock speed, cache, and circuit design.
According to Apple's announcement, the A20 Pro uses a 2nm process and widens memory bandwidth by 50% over the A19 Pro. It also places the chip die and memory side by side, taking the memory out of the heat dissipation path so the die can be bonded directly to the vapor chamber. Beyond the computing circuits, what we want to see is how much the improved ability to deliver data and the revised path for shedding heat matter in actual use.
Apple explains that sustained performance of the iPhone 18 Pro series, including the new cooling system, improves by up to 40% over the previous generation. This Geekbench listing is not a test that verifies that claim. Under the CPU execution conditions in Primate Labs' technical document, from Geekbench 6.1 onward a 5-second pause is inserted between workloads by default to reduce the effect of heat. A CPU score measured with pauses and the speed during long-running games or editing work confirm different things.
In Japan, preorders for the iPhone 18 Pro and Pro Max start on September 12, and they are scheduled to go on sale on September 18. If you are considering upgrading from the A19 Pro, check whether the scores reproduce on retail units, as well as how long your usual heavy tasks take and how much power they consume. If you are coming from the A18 Pro, the question is whether the two-generation gap seen in the comparison samples persists in photo editing and long-running tasks. If the A20 Pro can finish the same work with less power while maintaining speed, its advance should be noticeable in both waiting time and battery life.