When people hear "AI-controlled traffic signals," they tend to picture an AI deciding, one switch at a time, when to turn lights red or green. At least in the system the Tokyo Metropolitan Police Department (MPD) is developing, the reality is somewhat different. The AI detects and predicts congestion, then uses those results to propose signal adjustments or feed into automatic adjustment.In materials released in October 2023, the MPD described a system that uses current traffic information to predict which intersections will become congested 30 minutes later, and adjusts signals in advance. According to progress reported on the Tokyo Metropolitan Government's "Shin-Tosei" site, the plan for fiscal 2026 is to continue trials and verification aimed at automating signal adjustment, using functions added in fiscal 2025.If the wait at a traffic light on your commute gets shorter, can that be called a success of AI? To judge, you need to separate two things: what role the AI actually plays, and what the published "effect" figures really measure.
## Three numbers that determine signal control
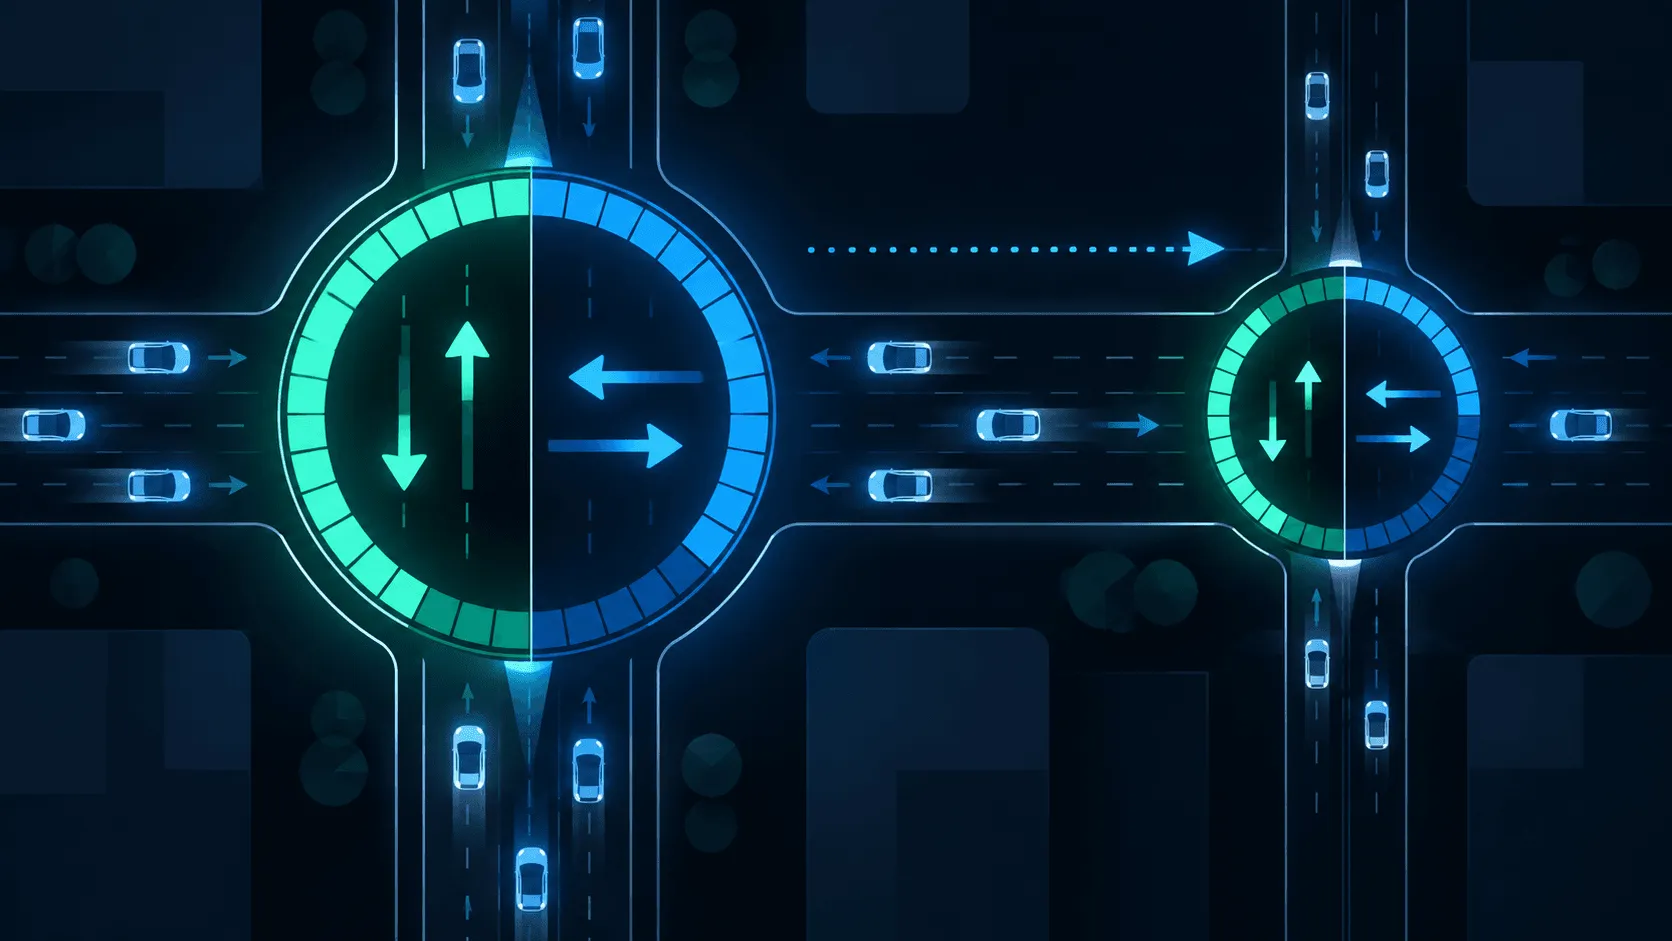
Three parameters are central to traffic signal control: cycle length, split, and offset.Cycle length is the time it takes for a signal to run through a full sequence and return to its starting state. The split shows how that cycle is divided into green time for each direction. The offset indicates how much the start of green is staggered between neighboring intersections.MPD materials line up these three parameters alongside the calculation interval to show how signal control has become more sophisticated. Before 1995, controllers chose from preset control patterns every 300 seconds; in 1995 this moved to real-time control every 150 seconds. In 2007 the interval became 50 seconds, and in 2009 demand-forecast control was added to the split.The same materials include a formula for cycle length.
> Traffic index = (arriving traffic + congestion) ÷ intersection capacityCycle length = 1.5 × lost time ÷ (1.0 − intersection traffic index)Lost time is the total of the yellow and all-red phases, the latter being the time when all directions show red. The materials present this as Webster's formula.Calculated simply, an intersection traffic index of 0.5 gives a cycle length three times the lost time, and 0.8 gives 7.5 times. Real operation adds further control constraints, but the basic relationship is clear: the heavier the congestion, the longer the cycle.The split is determined by "the traffic index of the direction in question ÷ the traffic index of the intersection." In other words, even before AI, control that varied green time according to traffic volume and current congestion was already in use.What the MPD's use of AI adds is the part that detects unusual congestion or predicts future congestion, and connects the results to signal adjustment.
## What does the congestion-length prediction AI look at?QTNN, a spatiotemporal AI announced in 2023 by a research group from Kyoto University and Sumitomo Electric System Solutions, was developed using traffic data from Tokyo provided by the MPD.It covers 1,098 sections of ordinary roads within Tokyo's 23 wards, with an average section length of 882 m and a median of 750 m. It uses about a year of data on average speed, traffic volume, and congestion length measured every five minutes.Prediction happens in two stages. First, deep learning predicts future average speed and traffic volume; those values are then fed into a traffic-engineering traffic flow model to obtain congestion length.Rather than simply producing congestion length from a neural network alone, the approach builds in a model of the relationship among traffic volume, speed, and congestion length, which makes the predictions easier to interpret in terms of traffic conditions.For congestion length one hour ahead, the published representative figure is "an error of 40 m or less." The error here is root mean square error (RMSE).Reading approximate values from the research graphs, across all data including periods without congestion, QTNN's RMSE is about 13 m at 15 minutes ahead, about 22 m at 30 minutes, about 31 m at 45 minutes, and about 38 m at 60 minutes. The farther ahead the prediction, the larger the error.What matters is that **the error becomes considerably larger when looking only at severe congestion.**The same materials separately evaluate the "worst 5%" of the data, where congestion length is greatest. Even for QTNN, the 60-minute-ahead RMSE reaches about 210 m. The 40 m figure alone cannot be read as meaning that even heavy congestion can be predicted to within 40 m.Nor can it be confirmed from published materials that QTNN is directly used in the MPD's "mechanism for predicting intersections that will be congested in 30 minutes." QTNN is a technology being considered for use in the MPD's project to advance traffic control, but its correspondence to any specific operational flow should be treated separately.QTNN also has characteristic prediction tendencies. MPD materials say that predictions may lag behind actual congestion, and that the peak of congestion may be predicted lower than it actually is.If predictions lag, the timing of advance adjustment may also be late. If the peak is underestimated, the amount of adjustment needed may be underestimated too. However, a prediction error does not translate directly into a signal-control error of the same size.
## From AI prediction to signal adjustmentOn October 26, 2023, at a working group steering meeting of the Tokyo Congestion Countermeasures Promotion Council, the MPD presented three streams of AI-based traffic control.
| Stream | Target | Roles of AI and humans | Status as of Oct. 2023 |
| ------------------------ | ------------------ | ------------------------------------------- | ------------------------- |
| Detect unusual congestion and respond | Key intersections | AI detects and proposes signal adjustment; on-duty staff decide and intervene | In operation |
| Detect unusual congestion and respond | General intersections | AI detects, judges whether signal adjustment is needed, and intervenes automatically | Effect being verified toward automation |
| Predict congestion and respond | Key intersections | Predicts congestion 30 minutes ahead from current traffic information and adjusts in advance | Effect being verified toward automation |
The 30-minute-ahead prediction is the third item. At that point it was still at the effect-verification stage.What was already in operation was a system in which AI detects "unusual congestion" that differs from the norm and proposes signal adjustments to staff at the traffic control center. Staff decided whether to extend the cycle length.Trials of automation have since progressed. In fiscal 2023, trials were carried out, limited by time of day and area, of automatic adjustment during unusual congestion at smaller general intersections, and of automatic signal adjustment based on congestion prediction at large intersections.In fiscal 2025, the signal adjustment function was upgraded while verifying the results of fiscal 2024 trials, and a function to generate traffic data from probe information was added. For fiscal 2026, the plan is to continue trials and verification toward automating signal adjustment using that function.The MPD's 2023 materials also include two cases in which AI detected unusual congestion and extended the cycle length.In one, when an accident occurred, the measured congestion length exceeded the simulated predicted value, so the AI judged it to be unusual congestion, and after signal adjustment the measured value fell below the predicted value.In the other, detection of the unusual congestion was delayed and spillback from downstream ("saki-zumari") was also occurring, so the congestion was not effectively relieved. The MPD says that improving the narrowing-down of signals to adjust is necessary to raise effectiveness.Conditions under which signal adjustment is not expected to help are also laid out.When downstream spillback is occurring, increasing green time at the target intersection does not increase the number of vehicles passing, because they cannot move forward. Adjusting an upstream intersection that is not at the head of the congestion is also not expected to help. And in heavy rain of 30 mm per hour or more, the number of vehicles that can pass per unit of time drops sharply, so such conditions are excluded from signal adjustment.
## Each "effect" figure measures something differentVarious "effect" figures have been published for AI signal control. But because they measure different things, they cannot be compared directly.
| Figure | What was measured | Target | Nature |
| --------------------------------- | --------------------------- | ----------------------- | ------------------------------------ |
| 15–20% reduction | Average travel time | 12 intersections in Shizuoka Prefecture | Simulation-based expectation presented at the start of the demonstration |
| 14 → 7 units | Number of vehicle detection sensors | Kokuseiji intersection, Okayama City | Control performance equivalent to before, even with sensors halved |
| 233.6 s → 227.4 s (−2.7%) | Average travel time at peak hours | 73 intersections in Tokyo | Measured results of multiple congestion countermeasures combined |
| 40 m or less | RMSE of congestion length prediction one hour ahead | 1,098 sections in Tokyo | Prediction accuracy, not signal wait time |
The 15–20% in Shizuoka is a figure NEDO and the UTMS Society of Japan presented when they began the demonstration in March 2022. NEDO itself explains that **simulations** of the algorithm it developed suggest an expected reduction in average travel time of about 20% compared with current signals and about 15% compared with centralized control. It does not mean a 15–20% reduction measured on actual roads.The announcement also estimated that, if a 20% reduction were achieved at roughly 200,000 intersections nationwide, the time benefit would be about 5.52 trillion yen per year and CO2 reduction about 5,500 t per year.However, a project overview NEDO published later gives the CO2 reduction as "about 5.5 million t per year," so **official materials carry figures that differ by three orders of magnitude**. When using the 5,500 t figure, it is therefore advisable to state clearly that it is the estimate given in the March 2022 demonstration-start announcement, and to be mindful of this discrepancy.What the Okayama demonstration showed is closer to "maintenance" than "reduction."NEDO, the UTMS Society of Japan, and Sumitomo Electric Industries controlled signals at the Kokuseiji and Senoo-nishi intersections in Okayama City using congestion length estimated by AI from traffic volume. At Kokuseiji, even after halving vehicle detection sensors from 14 to 7, congestion showed no change compared with the conventional method, and signal control performance was maintained. The aim is to achieve equivalent control with fewer sensors and lower equipment and maintenance costs.Tokyo's change from 233.6 to 227.4 seconds is a measured result, but not an effect of AI signal control alone. It covers 73 intersections where measures were taken from fiscal 2016 to fiscal 2019, combining advanced signal control such as demand-forecast signal control with traffic information boards, road markings, red-tinted pavement, and measures against taxis waiting for customers. At 59 of the 73 intersections, about 80%, improvement was confirmed in either the 12-hour daytime average or the peak-time average travel time.Placing this 2.7% next to Shizuoka's 15–20% and concluding that results fell short of expectations is not possible, because the targets, periods, measures, and evaluation methods differ.Likewise, QTNN's 40 m prediction error cannot be read as 40 m of improvement in signal waiting.
## AI's role is not only "prediction"
![]()
Even among traffic signal control that uses AI, the job the AI performs differs from case to case.In the Okayama demonstration, rather than directly predicting future congestion, the AI **estimated current congestion length** from values such as traffic sensor readings.The AI was trained on the relationship between past traffic volume and surrounding conditions and travel times obtained from probe information, and afterward estimates congestion length from traffic sensors. The test was whether signal control could be maintained even after reducing the sensors that had previously measured congestion length directly.In the Nagano case, the AI's role is different again. In July 2021, a landslide occurred along National Route 19 at Shinonoi Komatsubara in Nagano City, and alternating one-way traffic continued over a section of about 300 m. The measured throughput was about 1,300 vehicles per hour, while about 1,500 vehicles per hour normally passed at 7 a.m. on weekdays, causing congestion of up to about 3 km across the inbound and outbound lanes.The Nagano National Highway Office installed portable live cameras at 12 locations along the route and used AI image analysis to **measure the current tail of the congestion**. The method detects vehicles in the video and uses time occupancy to determine where congestion is occurring; initially it was set to 70% time occupancy with a 10-minute aggregation period.Signal patterns are selected according to that congestion tail. Where there had originally been four patterns each for morning, midday, and evening, the number increased to 26 after AI was introduced. Green time was in principle two minutes and at most five minutes, set on the basis of a prior survey confirming that about 160 m of congestion could be cleared per minute.Still, not everything was left to the AI. When switching from all-red to green, it was necessary to confirm that no vehicles remained within the restricted section, and this safety check was done visually by people until the restriction was lifted.In short, the AI's role differs across the three cases.In Okayama it is **estimation**; in Nagano, **measurement and pattern selection**; and in the MPD project, **detection and future prediction**. The single phrase "AI controls the signals" does not reveal what is actually being entrusted to the AI.
## How to judge whether a change in signal waits is AI's doingEven if signal waits on your commute seem shorter than before, the cause cannot be attributed to AI alone.Traffic volume varies by day and time of day, and is also affected by weather, accidents, roadworks, and downstream congestion. The MPD itself says that improvement from signal adjustment cannot be expected with spillback, at non-bottleneck intersections, or in heavy rain.The first thing to check is how far AI-based functions are actually in operation in the area. Next, it is necessary to distinguish whether a published figure is a measured travel time, a simulation-based expectation, or prediction accuracy.In the MPD's latest progress report, the signal adjustment function was upgraded in fiscal 2025 and a function to generate traffic data from probe information was added. For fiscal 2026, trials and verification toward automating signal adjustment are planned using that function.However, this description alone does not make clear whether that automatic adjustment is based on the "30-minute-ahead congestion prediction" presented in 2023, or whether it includes other functions as well.If, going forward, figures are published showing how many seconds travel time or stopping time changed, with the target intersections, time periods, and comparison periods aligned, it will become possible to evaluate more directly how much AI-based automatic adjustment actually affects waiting at signals.


