

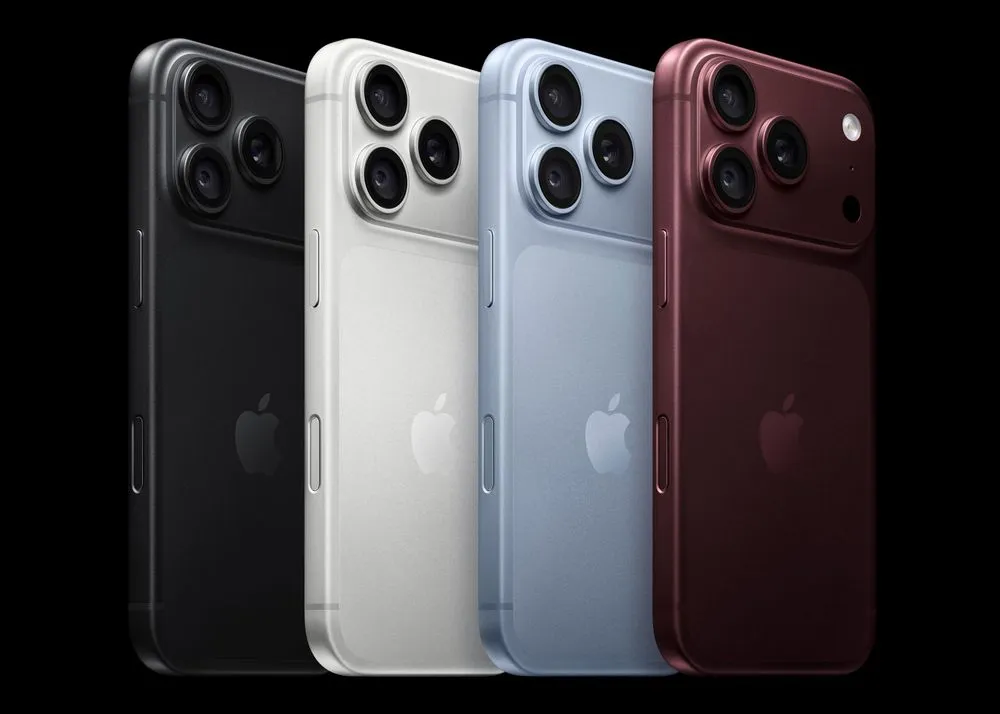
HOMOLAB has published measurements showing that the 1TB iPhone 18 Pro Max suffers a sharp drop in sustained write performance. Starting with 60% of the storage already used and continuing to write, the test recorded an average of 45MB/s and a minimum of about 1.1MB/s in a later stage. The high-capacity configuration reportedly uses QLC NAND, and the numbers show the gap between how much data the phone can store and how much it can keep writing at high speed. The result will concern people who handle large files, but judging everyday usability from the minimum figure alone misses what this test actually shows.
A Minimum of 1.1MB/s in the Later Stage of Sustained Writing
The HOMOLAB measurements cover the 1TB iPhone 18 Pro Max, reportedly a QLC configuration. The published chart is labeled "128K LT" and shows sustained writes from an empty state and from a state with 60% of capacity used. The figures below are based on HOMOLAB's charts as reposted elsewhere; I could not review the full video or the raw logs.
The test distinguishes several stages: an initial fast SLC cache, then a pseudo-TLC cache, and then write-back to QLC. While the SLC cache has room, writes run at around 3,000MB/s, but that speed does not last to the end.
| HOMOLAB 1TB sustained write test | Starting from empty | Starting at 60% used |
|---|---|---|
| SLC cache size | 249.7GB | 58GB |
| Average, pseudo-TLC cache stage | 578MB/s | 396MB/s |
| Average, QLC write-back stage | 79.4MB/s | 45MB/s |
| Minimum, QLC write-back stage | 25.6MB/s | 1.142MB/s |
Sources: chart for the empty state and chart for 60% used. Speeds and capacities follow the notation in the charts.
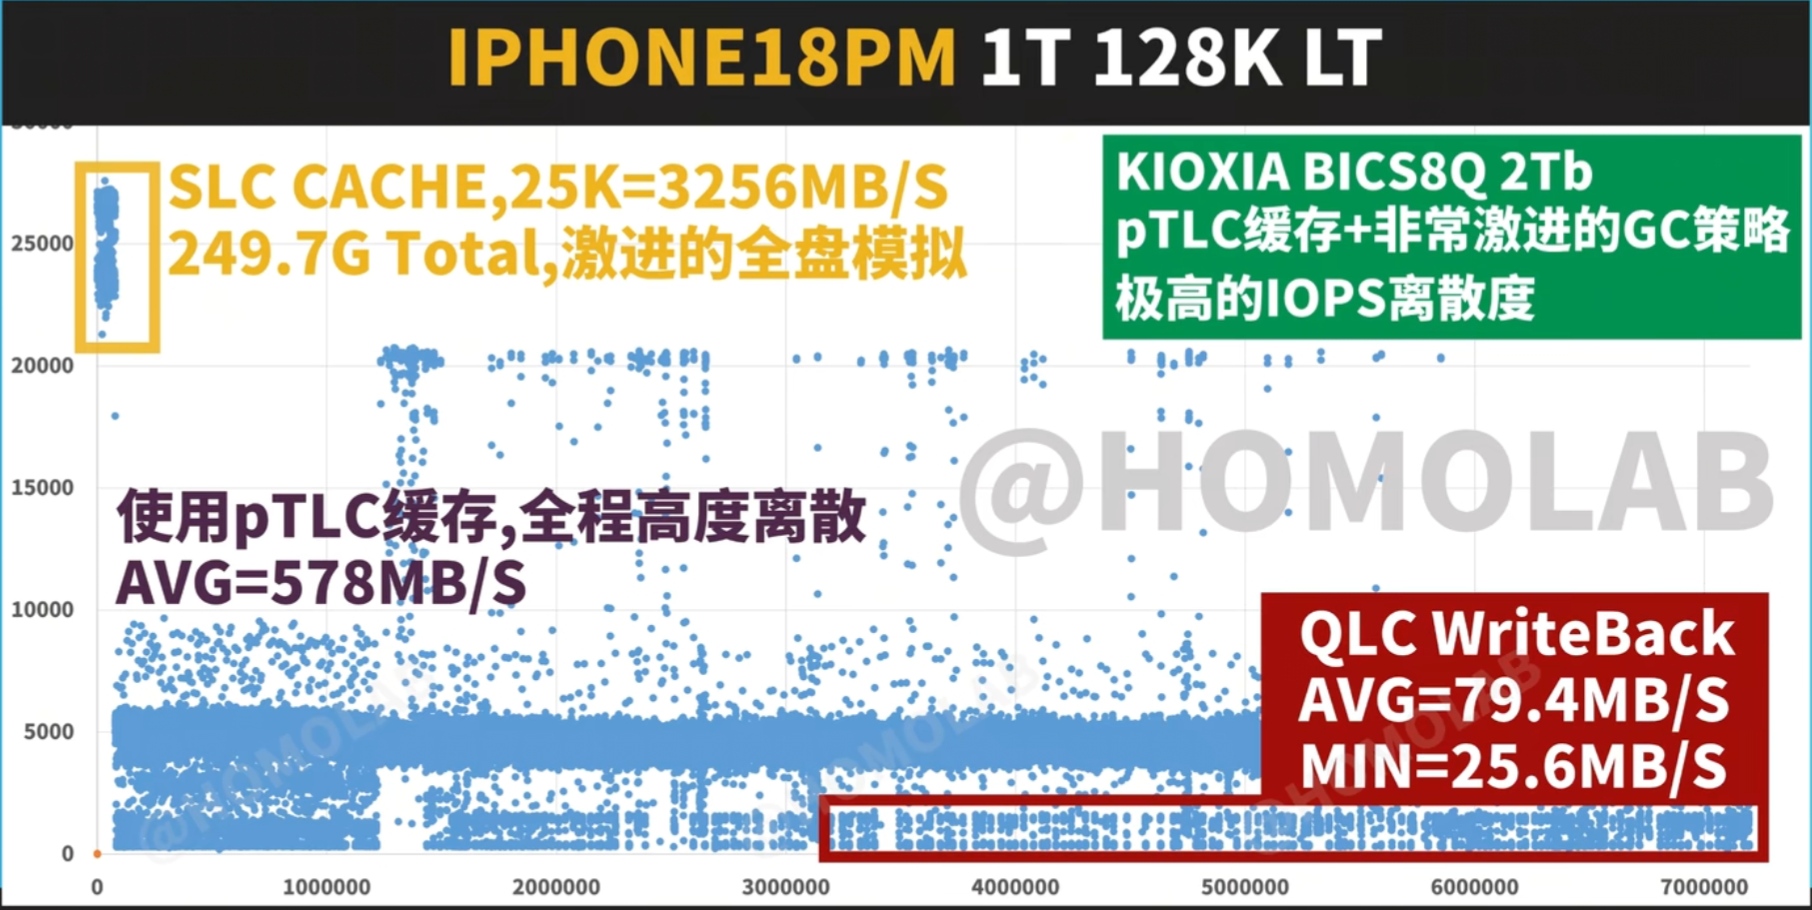
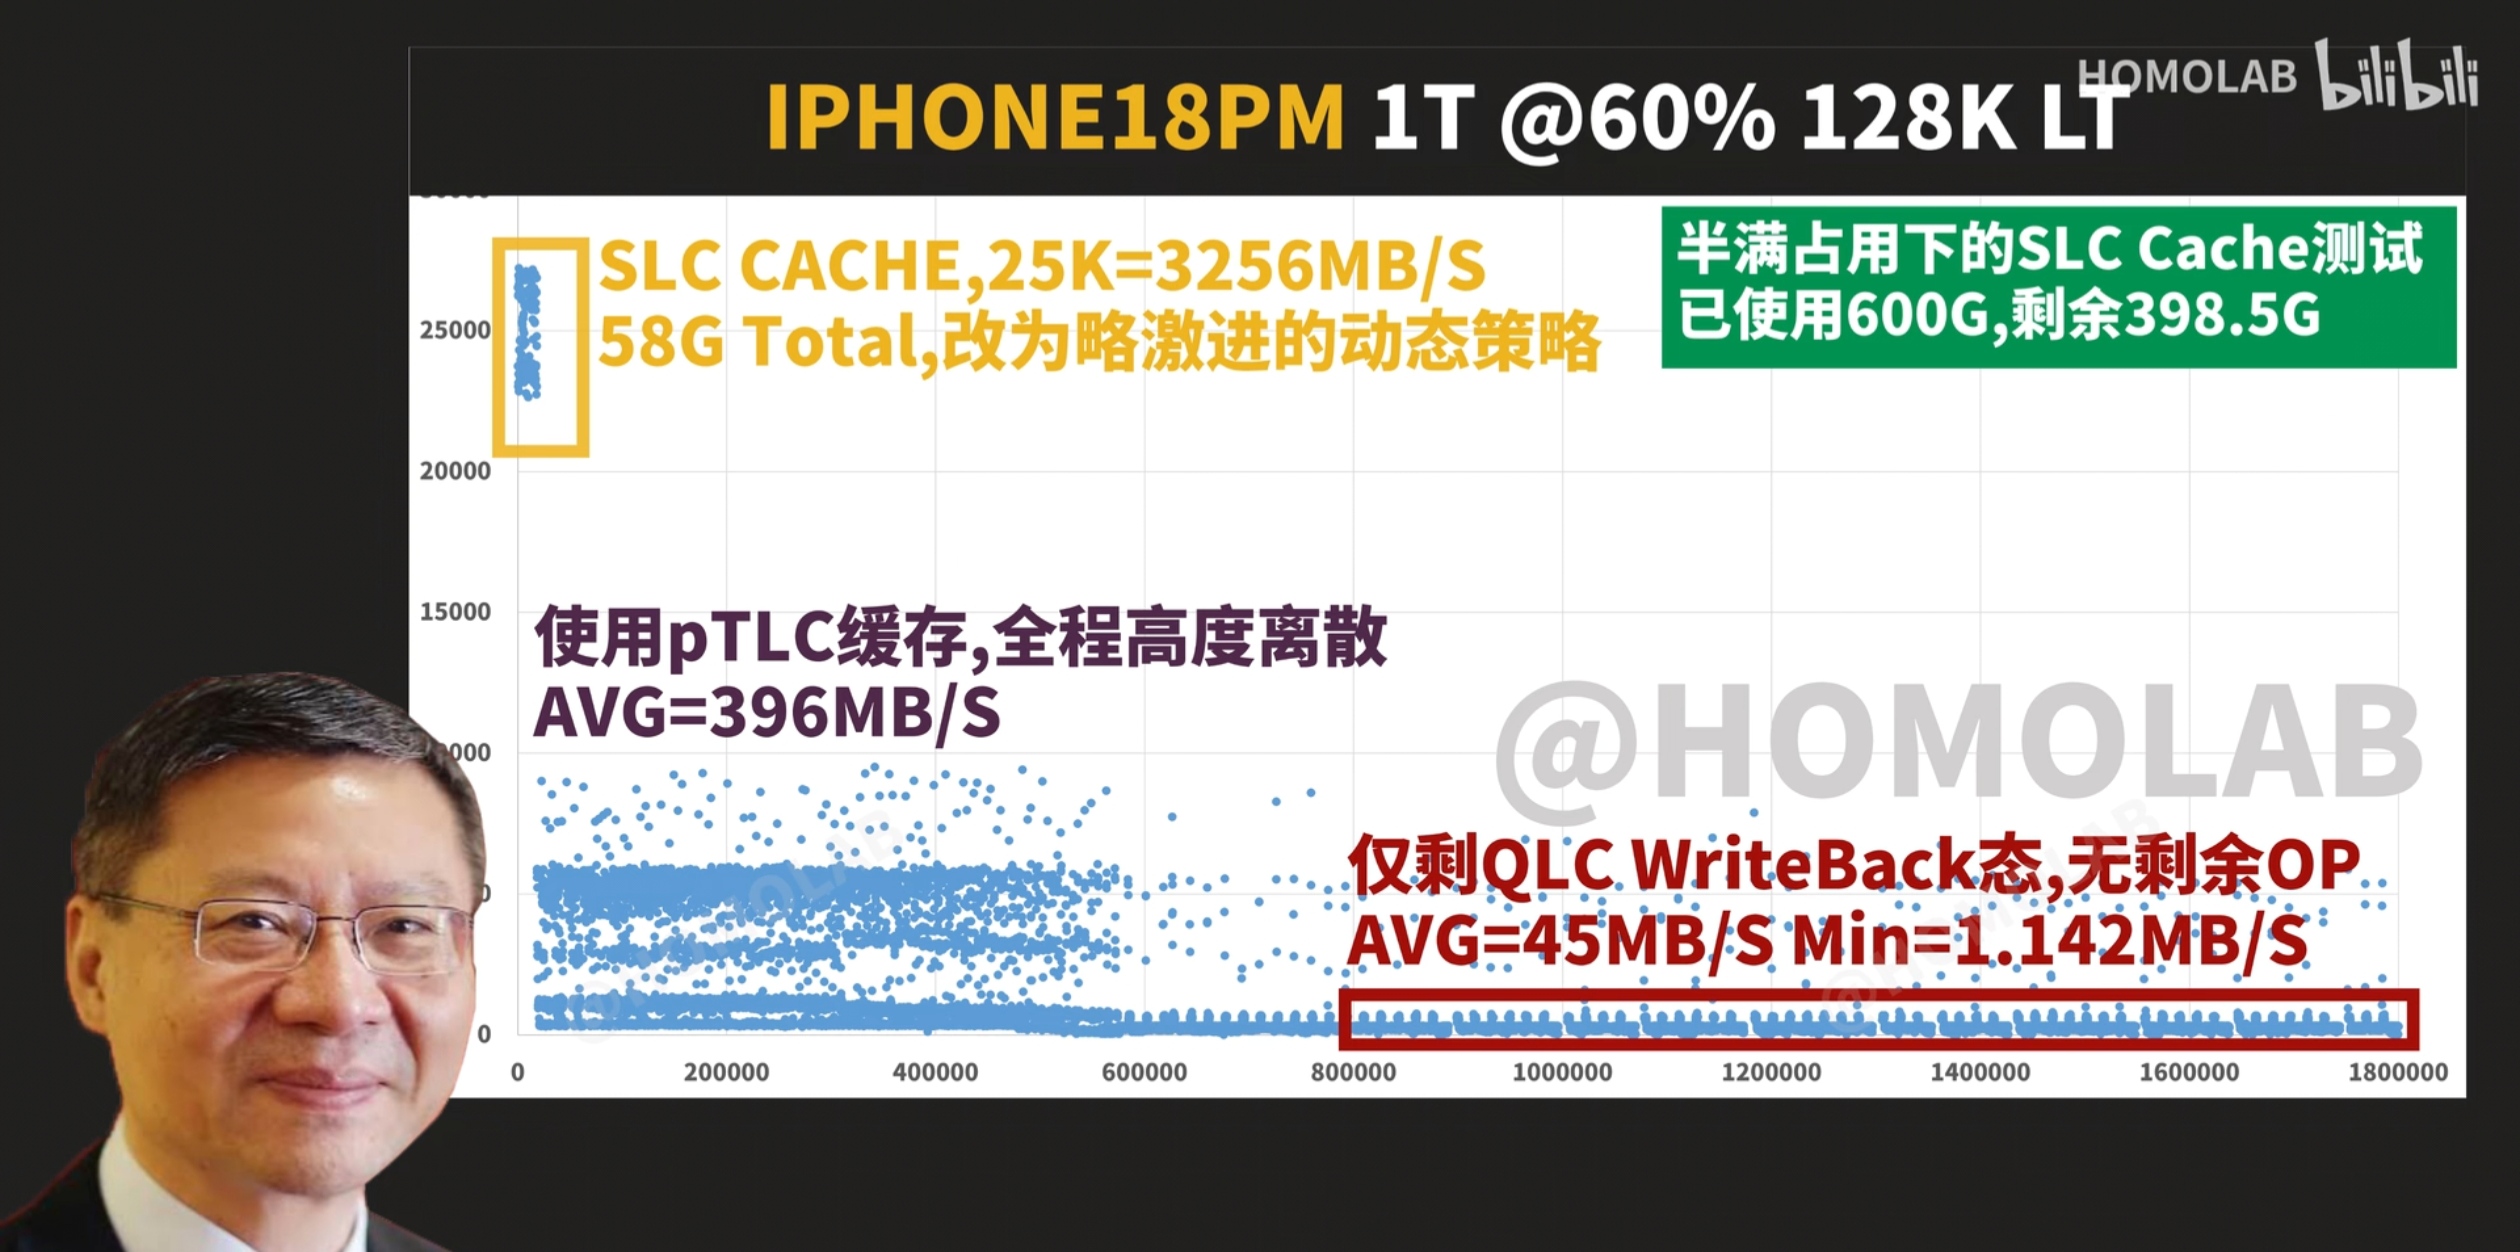
Beyond the drop in minimum speed, the notable point is that the cache that absorbs writes quickly is itself much smaller. A phone that already holds data cannot necessarily save the same amount at the same speed as an empty one.
However, 60% is the usage level at the start of the test. The results after continued heavy writing cannot be read as "speed falls to 1.1MB/s once usage exceeds 60%." The charts I reviewed also don't show how long the 1.142MB/s minimum lasted. It has to be read alongside the 45MB/s average for the same stage.
About 400GB Free, but Only 58GB of Fast Cache
The chart for the 60%-used state shows 398.5GB remaining against 600GB used. The SLC cache, meanwhile, is 58GB. Being able to store roughly 400GB more is not the same as being able to write all of it quickly.
The difference comes from how NAND flash records data. TLC stores 3 bits per cell and QLC stores 4. As Samsung's technical materials explain, QLC must distinguish 16 voltage states versus 8 for TLC, which requires finer control. For the same number of cells it holds more data, but it is harder to combine that density with write performance.
So part of the storage is used like SLC, recording 1 bit per cell. This lowers density but creates a place to receive data quickly. As the amount stored grows, the area available for cache and the way it is managed change. The shift from 249.7GB to 58GB here is an example of how free space also affects write performance.
HOMOLAB describes the middle stage as a "pseudo-TLC cache." This means QLC cells are being used in a TLC-like mode, not that separate TLC chips have been added. Data temporarily placed in the cache must be written back to use capacity efficiently.
Inside the NAND, valid data is also moved and old blocks erased so they can be reused for new writes. This process is called garbage collection. KIOXIA's technical materials explain that it causes write amplification, where more data is written inside the NAND than the device handed over.
The chart itself labels the slowed stage as write-back to QLC. It would therefore be wrong to treat the 45MB/s average as the raw write speed of QLC cells alone. It should be read as the result for the whole device, including cache management and internal data movement. Conversely, the initial roughly 3,000MB/s figure alone says nothing about waiting times when saving large amounts of data.
Whether the Gap Is 38% Depends on the Baseline
HOMOLAB's mixed read/write comparison chart compares the 1TB QLC configuration with a 512GB TLC configuration. In the low-concurrency "Q1T1 MIX" test, the published scores are 8,168 and 11,285 respectively. Expressed as a percentage, that difference changes depending on which side is the baseline.
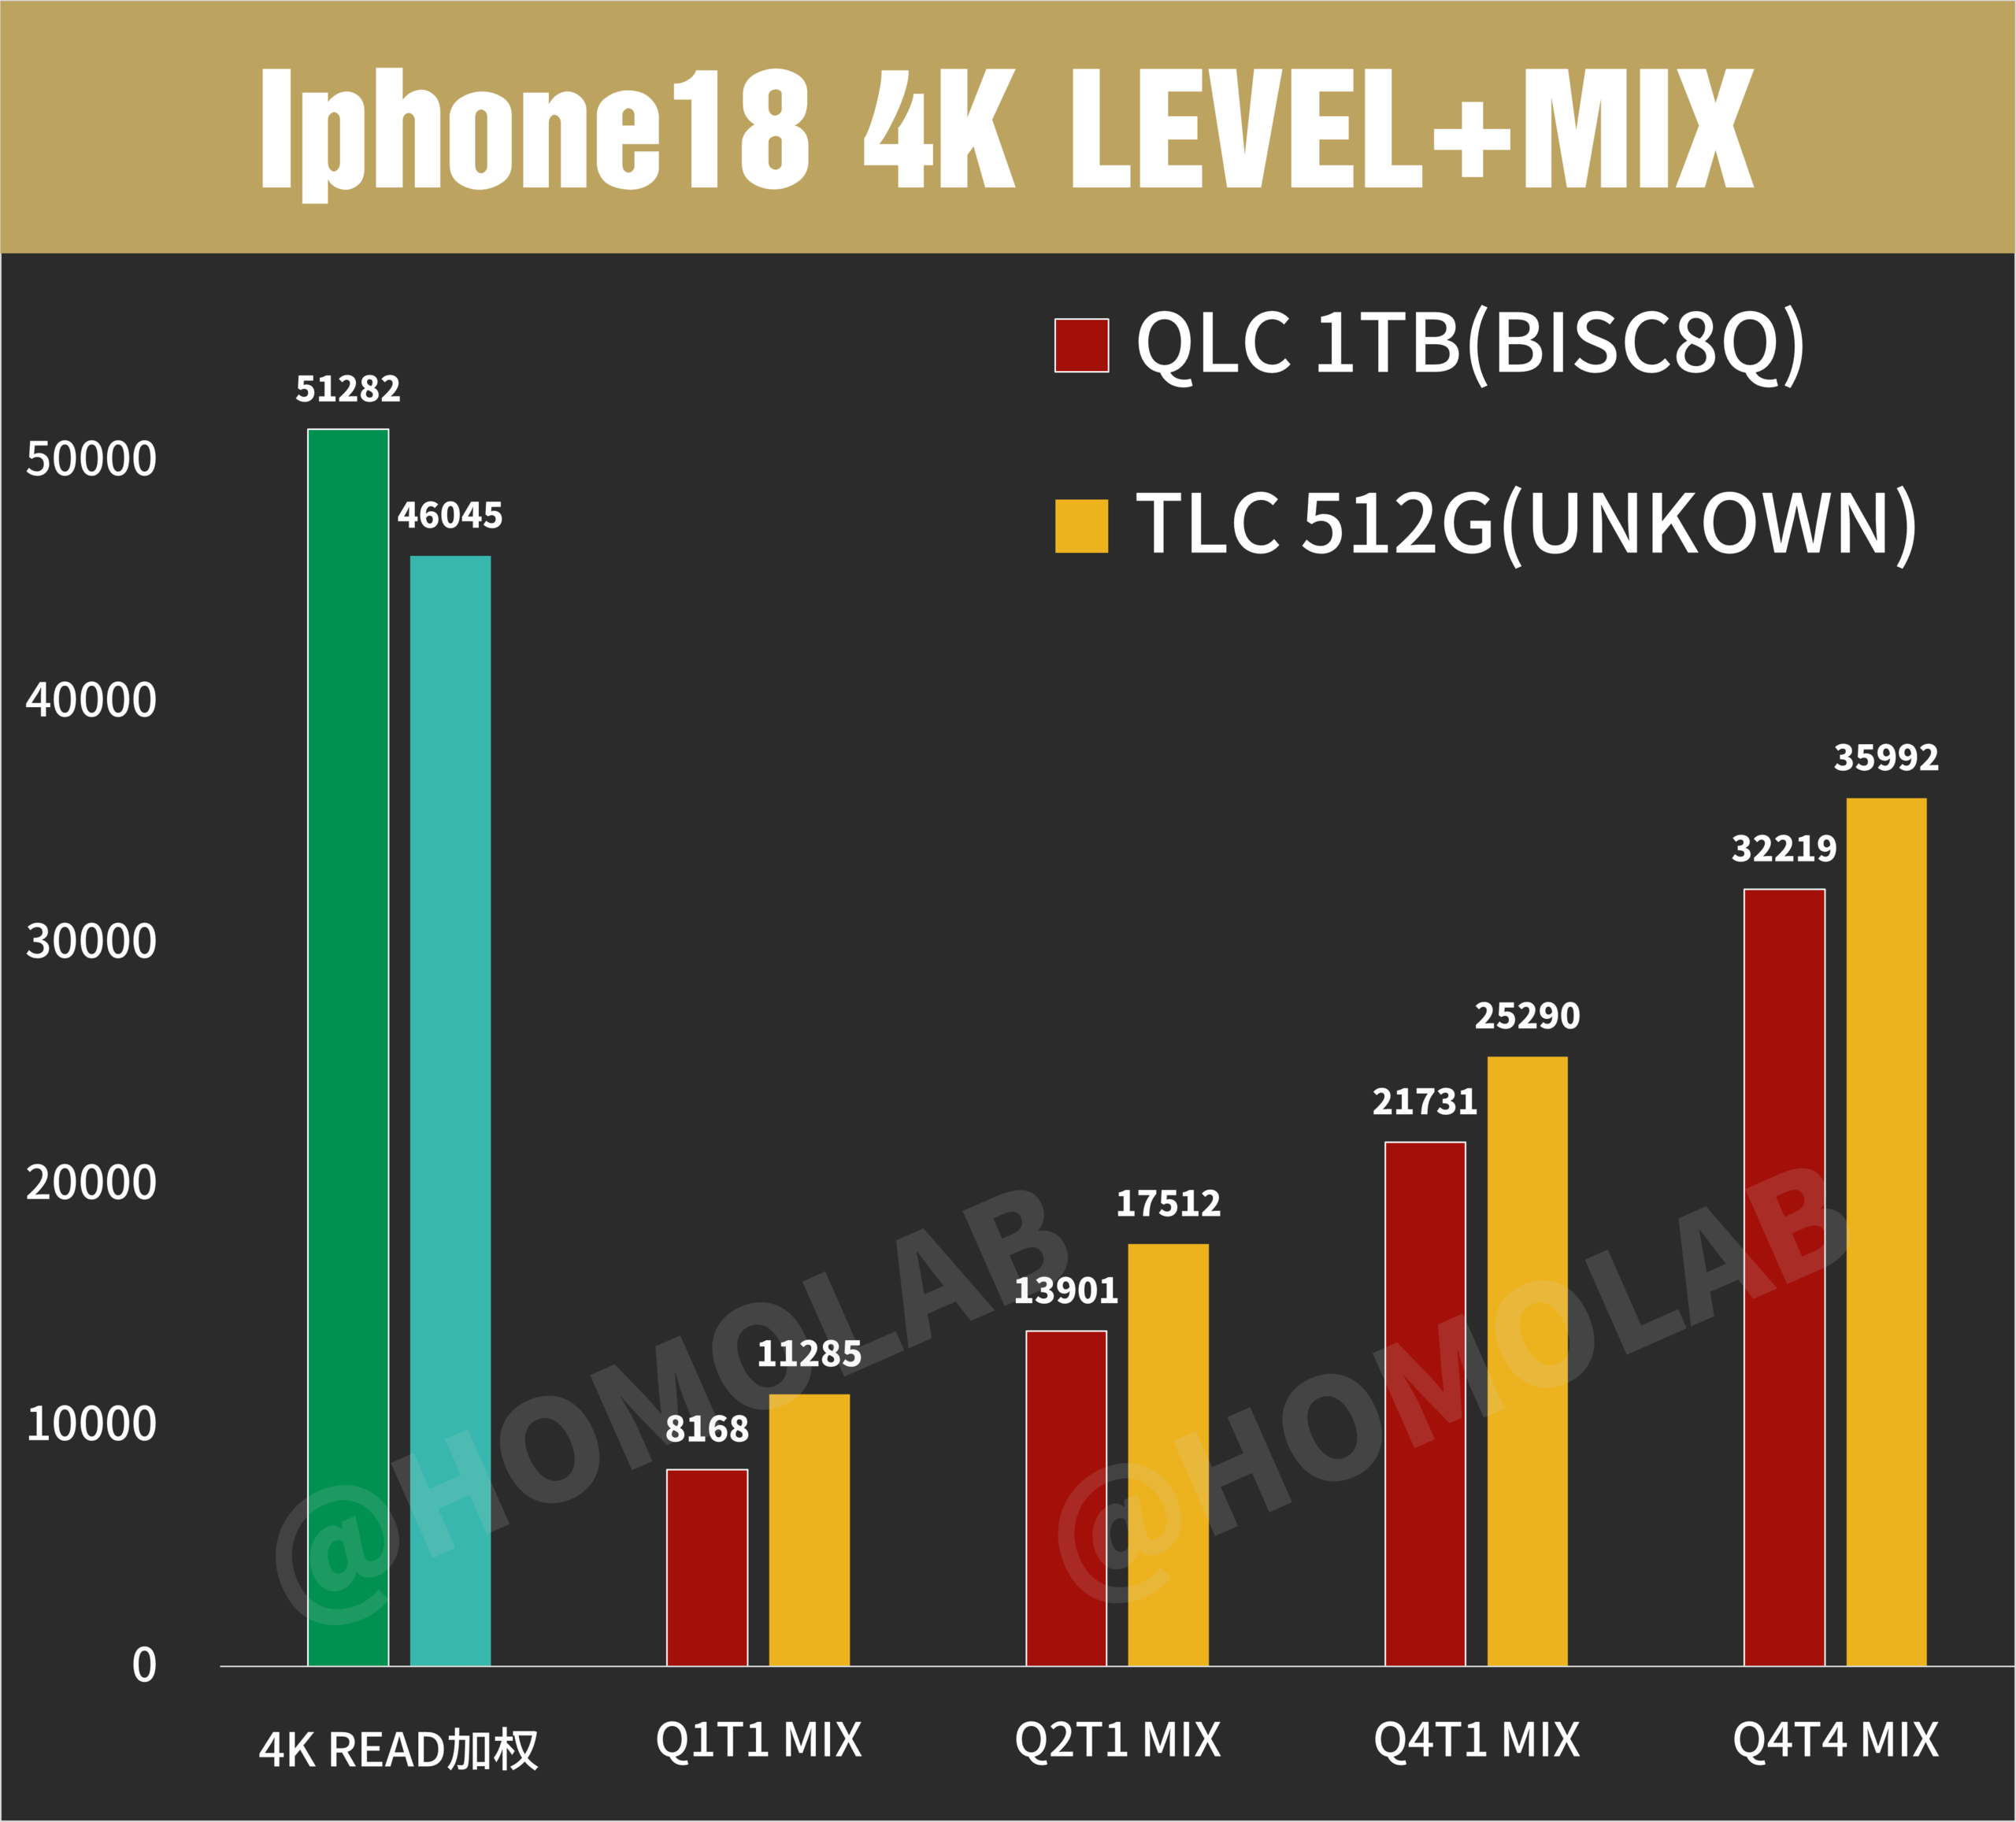
| HOMOLAB mixed test | 1TB QLC configuration | 512GB TLC configuration | QLC's shortfall relative to TLC |
|---|---|---|---|
| Q1T1 MIX | 8,168 | 11,285 | About 27.6% |
| Q4T4 MIX | 32,219 | 35,992 | About 10.5% |
In Q1T1 MIX, with QLC at 8,168 and TLC at 11,285, TLC is 38.2% higher using QLC as the baseline, while QLC is 27.6% lower using TLC as the baseline.
The shortfall was calculated as the score difference divided by the TLC score. For Q1T1 MIX, that is (11,285 − 8,168) ÷ 11,285, or about 27.6%. Dividing the same difference by the QLC score of 8,168 gives about 38.2%.
In other words, "TLC is about 38% faster" and "QLC is about 38% slower" do not mean the same thing. When comparing ratios, you need to look at the original value and the denominator together.
This is also not a comparison that swaps only the NAND type while keeping capacity and device configuration the same. The weighting used to calculate the chart scores and the full test settings are also unavailable, so the table cannot be used to say apps will run about 27.6% slower. What can be said is that the QLC configuration scored lower on the published mixed-load metrics, and that the size of the gap varies with concurrency.
Video Recording: Consider the Storage Destination Separately
In the iPhone 18 Pro specifications, Apple attaches an "external recording" condition to ProRes recording at up to 4K and 120fps. Footage recorded under that condition is written to external storage, so these internal NAND results cannot be used directly to judge whether recording is possible. Recording to internal storage and recording directly to external storage require looking at different storage destinations.
Even when internal storage is used, a sustained write test does not match how a camera app behaves. What matters is the balance between the incoming data rate and how much can be written back from the cache to the main storage. Simply dividing the 58GB cache by a video bitrate to calculate "recording will stop after X minutes" would also be premature.
Large file copies and backup restores are worth testing as use cases that involve continuous writing. So is long, high-bitrate recording. But the charts reviewed here do not show recording failures or restore delays in real apps. No conclusion can be drawn that everyday use will inevitably be affected, and there is no guarantee that it won't be.
Endurance should also be evaluated separately from speed. QLC is generally at a disadvantage against TLC in rewrite endurance, but a product's lifespan also depends on capacity, the amount written internally, error correction, and more. Apple's spec page does not state the NAND type or write endurance, so this measurement cannot be used to estimate usable years. It is also not settled from these charts whether every 1TB unit uses the same NAND configuration.
People choosing a high-capacity model want a phone that keeps shooting and handling migrations comfortably even after a lot of data has been stored. What would help their decision is a test run with data already on the device, using real apps and writing for as long as needed. If temperature conditions and storage destination were also matched, the headroom gained from more capacity could be weighed against the waiting time caused by long writes, in terms of actual use.