

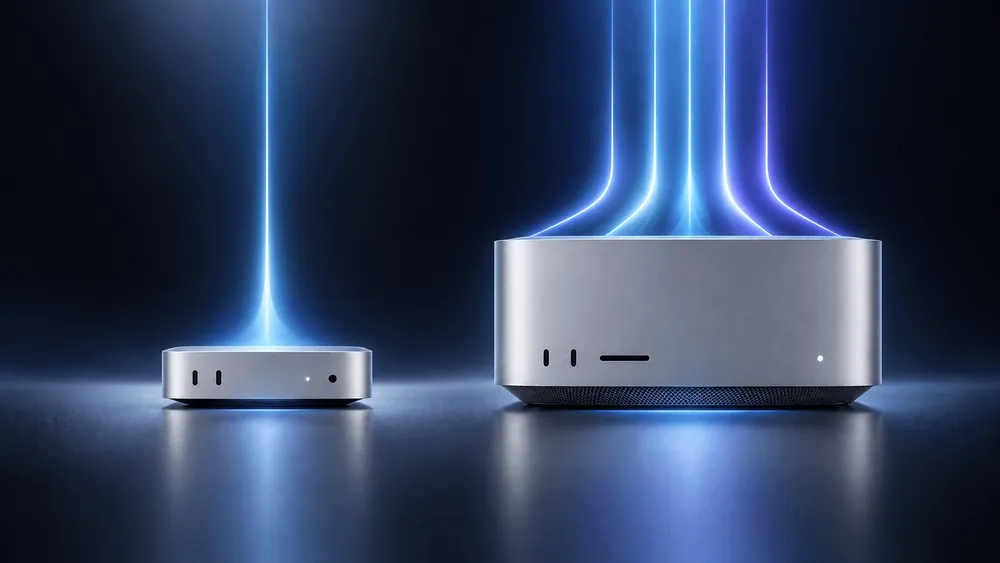
CPU benchmarks for Macs said to use Apple's M6 and M5 Ultra were posted to Geekbench Browser on September 15, 2026. The M6 scored 4,071 in single-core, and the M5 Ultra scored 52,516 in multi-core. The results suggest that generational gains in compact-Mac chips and the strengthening of the many-core Ultra are moving in different directions. Compared with aggregated results for earlier Macs, the standard M6 reaches a multi-core score close to the M1 Ultra's, while the M5 Ultra's advantage varies widely by workload. When deciding whether to upgrade, it helps to look not only at overall rankings but also at how much of a difference shows up in the tasks that actually keep you waiting.
We confirmed the M6 listing and the M5 Ultra listing. Both use the macOS AArch64 build of Geekbench 7.0.0, and the OS is shown as macOS 27.0, build 26A428.
| Listed item | M6 | M5 Ultra |
|---|---|---|
| Model identifier | Mac18,5 | Mac17,15 |
| CPU cores | 12 | 36 |
| Memory | 32GB | 256GB |
| Listed frequency | 4.78GHz | 4.61GHz |
| Single-core | 4,071 | 3,774 |
| Multi-core | 22,783 | 52,516 |
This difference in configuration is the premise for reading the results. The M5 Ultra has three times as many CPU cores as the M6, and its memory capacity also differs. The listed frequency is not a sustained clock speed during the test, and the listings alone do not reveal power settings or cooling conditions. These are neither official measurements from Apple nor product reviews that independently verified the authenticity of the listings, so we treat each as a single public listing for its chip.
All comparisons are also aligned to Geekbench 7 CPU scores. According to Primate Labs' explanation, this version enlarges the input data and includes in the multi-core tests only those tasks that use multiple threads in real applications. HTML5 Browser, for example, is not part of the multi-core side. Mixing in Geekbench 6 numbers, or dividing the multi-core score by the single-core score and interpreting it as core utilization efficiency, would change what the comparison means.
The M6 is an evolution of the standard chip, approaching the M1 Ultra in multi-core
The M6's multi-core score of 22,783 is 48.4% higher than the 15,353 aggregate for the M4 Mac mini. Single-core also rises 24.2%, from 3,278 to 4,071. Viewed as an update from the previous Mac mini, the gain is larger on the side that uses multiple cores.
| Chip | Model used | CPU cores | Single | Multi |
|---|---|---|---|---|
| M1 | Mac mini (2020) | 8 | 2,187 | 8,577 |
| M2 | Mac mini (2023) | 8 | 2,403 | 9,811 |
| M3 | MacBook Pro 14 (2023) | 8 | 2,762 | 11,506 |
| M4 | Mac mini (2024) | 10 | 3,278 | 15,353 |
| M5 | MacBook Pro 14 (2025) | 10 | 3,643 | 17,959 |
| M6 | Mac18,5 (individual listing) | 12 | 4,071 | 22,783 |
The sources are Geekbench's Mac aggregate and the M6 listing above. The aggregate values were viewed on September 17, 2026, and cover models with at least five independent submitted results. Only the M6 is a single listing adopted for this article, and the table is not a collection of the best results for each generation. The M3 and M5 use MacBook Pro models, so the difference in enclosures should be kept in mind.
データを表で見る
| シングルコア (スコア) | |
|---|---|
| M1 | 2,187 |
| M2 | 2,403 |
| M3 | 2,762 |
| M4 | 3,278 |
| M5 | 3,643 |
| M6 | 4,071 |
Single-core scores for the standard chips have risen with each generation, and this M6 listing is 11.7% higher than the 3,643 aggregate for the M5 14-inch MacBook Pro. This is a rough indicator of how quickly a chip can push through a single task, but it does not mean every app operation becomes lighter by the same proportion.
データを表で見る
| マルチコア (スコア) | |
|---|---|
| M1 | 8,577 |
| M2 | 9,811 |
| M3 | 11,506 |
| M4 | 15,353 |
| M5 | 17,959 |
| M6 | 22,783 |
In multi-core, the M6 is 26.9% above the M5's 17,959 and 2.66 times the M1 Mac mini's 8,577. The percentage increase is calculated as new score ÷ comparison score − 1, and the multiple is a simple division of the two. Because these were recalculated from aggregate values at the time of viewing, the percentages may differ slightly from those in articles published right after the listings appeared.
More interesting is the distance to the aggregate 23,372 for the M1 Ultra Mac Studio. The M6 trails it by only 2.5% in multi-core, and in single-core it is 83.5% above the M1 Ultra's 2,218. This suggests that the standard chip has come closer to some of the CPU workloads once handled by top-tier workstations. However, this is convergence in an overall CPU test. It does not mean that GPU scale or the amount of data the machine can handle has become the same.
How much did the M5 Ultra improve over the previous Ultras?
Dividing the M5 Ultra's 52,516 by the standard M1 Mac mini's 8,577 gives 6.12 times. But this figure includes not only the CPU's generational update but also the effect of moving from an 8-core standard chip to a 36-core Ultra, a different product class. For someone replacing an older Mac Studio, the difference between Ultras is the more direct basis.
| Chip | Model used | CPU cores | Single | Multi |
|---|---|---|---|---|
| M1 Pro | MacBook Pro 14 (2021) | 10 | 2,198 | 13,933 |
| M1 Max | Mac Studio (2022) | 10 | 2,229 | 14,307 |
| M1 Ultra | Mac Studio (2022) | 20 | 2,218 | 23,372 |
| M2 Pro | Mac mini (2023) | 12 | 2,413 | 16,411 |
| M2 Max | Mac Studio (2023) | 12 | 2,541 | 17,385 |
| M2 Ultra | Mac Studio (2023) | 24 | 2,518 | 27,779 |
| M3 Pro | MacBook Pro 16 (2023) | 12 | 2,811 | 16,900 |
| M3 Max | MacBook Pro 16 (2023) | 16 | 2,825 | 24,653 |
| M3 Ultra | Mac Studio (2025) | 32 | 2,907 | 38,862 |
| M4 Pro | Mac mini (2024) | 14 | 3,312 | 24,748 |
| M4 Max | Mac Studio (2025) | 16 | 3,496 | 29,071 |
| M5 Pro | MacBook Pro 16 (2026) | 18 | 3,692 | 33,598 |
| M5 Max | MacBook Pro 16 (2026) | 18 | 3,731 | 35,120 |
| M5 Ultra | Mac17,15 (individual listing) | 36 | 3,774 | 52,516 |
These were extracted from the Mac aggregate with the model and CPU core count fixed. Only the M5 Ultra is an individual listing; the rest are aggregate values viewed on September 17. For the M2 Ultra, we used the Mac Studio rather than the Mac Pro. Even for the same chip name, values change if the enclosure or core configuration differs, so we do not present these as "the chip's score" without specifying the model.
データを表で見る
| マルチコア (スコア) | |
|---|---|
| M5 Ultra(投稿) | 52,516 |
| M3 Ultra | 38,862 |
| M5 Max | 35,120 |
| M5 Pro | 33,598 |
| M4 Max | 29,071 |
| M2 Ultra | 27,779 |
| M4 Pro | 24,748 |
| M3 Max | 24,653 |
| M1 Ultra | 23,372 |
| M6(投稿) | 22,783 |
| M5 | 17,959 |
| M2 Max | 17,385 |
| M3 Pro | 16,900 |
| M2 Pro | 16,411 |
| M4 | 15,353 |
| M1 Max | 14,307 |
| M1 Pro | 13,933 |
| M3 | 11,506 |
| M2 | 9,811 |
| M1 | 8,577 |
The M5 Ultra's listed value is 2.25 times the M1 Ultra aggregate, 1.89 times the M2 Ultra aggregate and 1.35 times the M3 Ultra aggregate. Against the M3 Ultra, that is a 35.1% increase. The "6 times" from the M1 and the "2.25 times" from the M1 Ultra have different denominators.
The choice of individual listing also moves the multiple. For example, one M1 Ultra listing posted on the same September 15 has a multi-core score of 24,362; using it as the denominator makes the M5 Ultra 2.16 times as high. Simply swapping an average for one strong result changes how the progress looks.
The relationship with the M5 Max is also not a simple doubling. The 18-core M5 Max 16-inch MacBook Pro has an aggregate of 35,120, and the 36-core M5 Ultra listing is 1.50 times that. Apple explains that the M5 Ultra connects two M5 Max chips with UltraFusion and operates a total of four dies as a single processor. However, this score difference also includes differences in enclosure and memory conditions, and it is not an experiment that measured the efficiency of the interconnect itself. The effect of doubling the core count from the M5 Max cannot be isolated from this overall score alone. The per-workload comparison that follows covers the M6 and M5 Ultra and does not show gains relative to the M5 Max.
Against AMD, Intel and Qualcomm: where each is strong
The M6's single-core 4,071 is 19.9% above the 3,396 of the Snapdragon X2 Elite Extreme X2E-96-100 in Geekbench's CPU aggregate. In multi-core, however, it is 15.8% below that Snapdragon's 27,045. High single-core performance alone cannot represent a CPU's overall processing capability.
| CPU | Cores | Single | Multi |
|---|---|---|---|
| M6 (individual listing) | 12 | 4,071 | 22,783 |
| M5 Ultra (individual listing) | 36 | 3,774 | 52,516 |
| Snapdragon X2 Elite Extreme X2E-96-100 | 18 | 3,396 | 27,045 |
| Ryzen 9 9950X3D2 | 16 | 3,163 | 28,167 |
| Ryzen 9 9950X | 16 | 3,048 | 25,768 |
| Core Ultra 7 270K Plus | 24 | 2,933 | 27,402 |
| Core Ultra 9 285K | 24 | 2,832 | 25,837 |
| Ryzen AI Max+ 395 | 16 | 2,442 | 20,978 |
| Ryzen Threadripper 9980X | 64 | 2,850 | 37,849 |
| Ryzen Threadripper 7970X | 32 | 2,575 | 35,262 |
The M6 and M5 Ultra are individual listings from September 15, and the rivals are Geekbench 7 aggregate values viewed on September 17. On the PC side too, only CPUs with at least five submitted results are included. The aggregates may include systems with different operating systems, memory configurations and power settings. This comparison is meant to place chips ranging from laptop-class to desktop and workstation-class on the same test scale; it is not a contest at equal price or equal power consumption.
データを表で見る
| シングルコア (スコア) | |
|---|---|
| M6(個別投稿) | 4,071 |
| M5 Ultra(個別投稿) | 3,774 |
| Snapdragon X2 Elite Extreme X2E-96-100 | 3,396 |
| Ryzen 9 9950X3D2 | 3,163 |
| Ryzen 9 9950X | 3,048 |
| Core Ultra 7 270K Plus | 2,933 |
| Core Ultra 9 285K | 2,832 |
| Ryzen AI Max+ 395 | 2,442 |
| Ryzen Threadripper 9980X | 2,850 |
| Ryzen Threadripper 7970X | 2,575 |
In single-core, the M6 beats the aggregate values of every CPU chosen for this comparison. In multi-core, it is higher than the Ryzen AI Max+ 395's 20,978 but does not reach the aggregates for the Ryzen 9 9950X or Core Ultra 9 285K. Even if a small chip has high single-core performance, the ranking differs for workloads that keep many cores busy for long periods.
The M5 Ultra's multi-core 52,516 is 38.8% above the 37,849 aggregate for the 64-core Ryzen Threadripper 9980X. However, these Geekbench results do not mean the same gap would appear in large-scale rendering or scientific computing. For CPUs with more cores, results depend on how well the software can parallelize its work. Without measured power consumption, this also provides no basis for naming a winner in performance per watt.
Inside the 2.31x overall figure, gaps vary widely by task
In these two listings, the M5 Ultra's multi-core multiple over the M6 is 2.31x overall, but by task it ranges from 1.44x in File Compression to 3.43x in Asset Compression.
The next chart pulls out all eight items in the multi-core section of both listings. These are CPU versions of the tasks, so even something named Ray Tracing is not a GPU benchmark.
- M6
- M5 Ultra
データを表で見る
| M6 (スコア) | M5 Ultra (スコア) | |
|---|---|---|
| ファイル圧縮 | 16,934 | 24,350 |
| 写真ライブラリ | 23,594 | 53,728 |
| Clangコンパイル | 31,202 | 82,084 |
| テキスト処理 | 23,770 | 36,937 |
| アセット圧縮 | 27,698 | 95,110 |
| HDR処理 | 16,526 | 28,943 |
| 写真編集 | 18,393 | 54,913 |
| レイトレーシング | 29,096 | 96,491 |
The Ultra's lead widens in compilation and ray tracing and is comparatively small in file compression and HDR processing. Even within the same "multi-core performance," the benefit that many cores bring depends on the content of the work.
| Task | M6 | M5 Ultra | Ultra / M6 |
|---|---|---|---|
| File Compression | 16,934 | 24,350 | 1.44x |
| Photo Library | 23,594 | 53,728 | 2.28x |
| Clang Compile | 31,202 | 82,084 | 2.63x |
| Text Processing | 23,770 | 36,937 | 1.55x |
| Asset Compression | 27,698 | 95,110 | 3.43x |
| HDR Processing | 16,526 | 28,943 | 1.75x |
| Photo Editing | 18,393 | 54,913 | 2.99x |
| Ray Tracing | 29,096 | 96,491 | 3.32x |
Sources: M6 multi-core breakdown and M5 Ultra multi-core breakdown. Each multiple is the M5 Ultra score divided by the M6 score for that row, rounded to two decimal places. The overall figure is 52,516 ÷ 22,783, or 2.31x. Both are same-day listings with Geekbench 7.0.0 and the same macOS build, but the M6 has 12 cores and 32GB, while the M5 Ultra has 36 cores and 256GB.
Even tests with similar names show differences. File Compression is 1.44x, whereas Asset Compression is 3.43x. Lumping these together as "compression doesn't scale on the Ultra" would overlook the large gap in the latter. For developers, the 2.63x in Clang is a useful reference, but real builds also include linking and storage waits, so the time for an entire project will not necessarily change by the same multiple.
Why the gaps widen cannot be pinned down from these two listings alone. In addition to the degree of parallelization, memory access and cache usage may also play a role. The M5 Ultra also differs in memory capacity, so this is not a measurement in which only the core count was changed in an otherwise identical environment. What the results tell us is that the multiple obtained from the overall score cannot be applied uniformly to individual tasks.
When upgrading, check your own workload rather than the overall score
For someone coming from a standard M1 or M2 Mac, the M6's published scores show a large difference in both single-core and multi-core. For updates from the M4 or M5, the assessment changes depending on whether daily waiting time comes from CPU computation or from insufficient memory or slow reads and writes. A CPU ranking table alone cannot tell you whether the latter would improve.
For owners of older Ultras, it makes sense to combine the 35.1% overall difference versus the M3 Ultra with per-task measurements in the software they actually use. Apple's stated M5 Ultra specifications of up to 512GB of memory and 1.2TB/s of bandwidth are another factor in the decision for those handling large datasets. The M6's maximum memory is 32GB. Even if its overall CPU score approaches that of older Ultras, the condition of whether large models or datasets can be loaded into memory remains.
Apple's own stated figures also cannot be checked without matching the test conditions. The company says the M6's multithreaded performance is up to 1.2x that of the M5, and the M5 Ultra's is up to 1.3x that of the M3 Ultra, but the footnotes point to specific industry-standard benchmarks run on prototype units. It is not stated that they are the same test as this Geekbench 7. The fact that the listed values exceeded the stated multiples is not treated as evidence that Apple's claims about AI performance or power efficiency have been verified.
What is needed next is the time, and the power consumed during it, when the same apps and data are processed repeatedly on retail machines. Once we can also see whether speed holds up over long tasks and whether real GPU and AI work gets shorter, it will be possible to choose, based on actual waiting time, between jobs that a generational update to a compact Mac can handle and jobs where investing in an Ultra makes sense.