

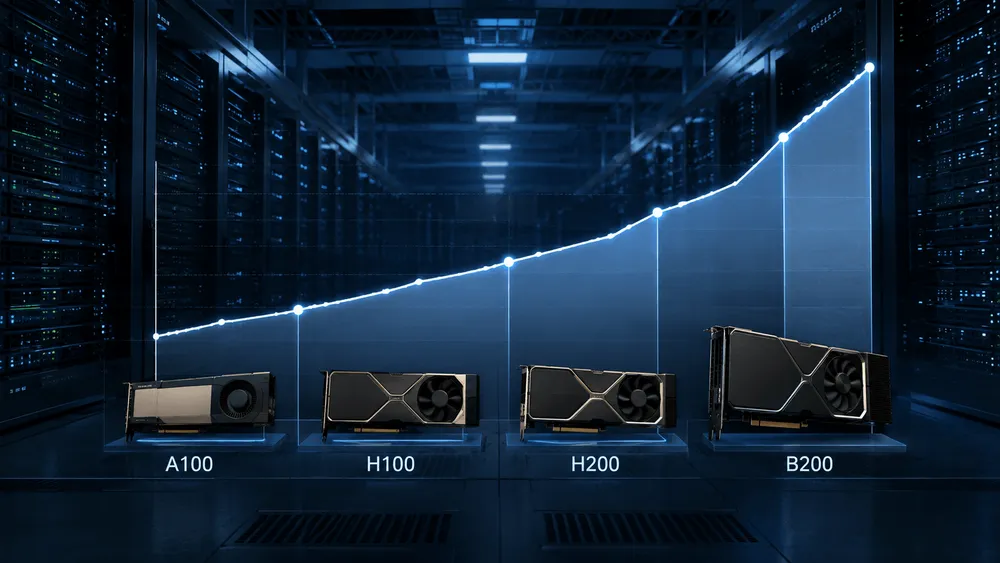
Comparing NVIDIA data center GPUs across generations using only hourly rates oversimplifies the picture. In Silicon Data's August 2 readings, the standardized rental price for NVIDIA B200 stood at $5.66 per GPU per hour. H100 came in at $2.80 for neoclouds and $7.19 for hyperscalers—a wide gap under the same GPU name. This divergence shows that chip generation alone can't explain the pricing.
This gap demonstrates that hourly rates aren't determined by GPU generation alone. Rising rental fees can serve as a clue about whether equipment remains in active use. But drawing the conclusion that companies can extend the accounting useful life of their GPUs requires additional information beyond that signal.
B200 at $5.66, H100 Split Into Two Tiers
Silicon Data publishes a daily index tracking cloud GPU pricing. As of August 2, the displayed values were as follows. H100 and A100 are split between neocloud and hyperscaler categories, while H200 and B200 are tracked as a single standardized index.
| GPU | Aug 2 Index (per GPU/hour) | Index Category |
|---|---|---|
| B200 | $5.66 | Standardized Index |
| H200 | $3.16 | Standardized Index |
| H100 | $2.80 / $7.19 | Neocloud / Hyperscaler |
| A100 | $1.64 / $3.72 | Neocloud / Hyperscaler |
Year-to-date movement has also been uneven. The B200 index rose from $4.40 on January 1 to $5.48 on March 30, peaking at $6.11 on March 25. March's average was $5.09, the median was $4.96, and the 10th-to-90th percentile range spanned $4.56 to $6.05. The August 2 figure of $5.66 sits roughly 29% above the January starting point.
Compared to the March 25 peak of $6.11, the August 2 value is actually lower. Still, B200 has shifted its overall price band upward, from $4.40 at the start of the year to $5.66 now. When reading daily index figures, it's important to look not just at the rate of increase but also at where the average, median, and peak values fall. This helps avoid mistaking a single expensive rental deal for a broader market-wide shift.
That said, the short-term price increase in the neocloud H100 index wasn't a phenomenon shared across all GPUs. According to Silicon Data, this index rose 10% over four weeks, from $2.00 per hour on December 9, 2025 to $2.20 on January 6, 2026. During the same period, A100 and B200 showed no notable change. Treating the GPU market as a single price curve risks overlooking these generation-specific and channel-specific discrepancies.
Hourly Rates Incorporate Conditions Beyond the GPU Itself
Silicon Data explains that when standardizing each provider's pricing into comparable on-demand rates, it adjusts not only for GPU type but also for memory and CPU configuration, contract duration, interconnect and cluster scale, and data center region. In other words, the index isn't a used-price for a standalone card. It's the price of capacity, with the actual computing environment conditions that customers rent normalized across providers.
The underlying data also isn't limited to publicly listed cloud provider rate cards. Silicon Data states that it includes colocation markets, brokered cluster sales, and private rental platforms. To distinguish whether a change reflects a single provider's pricing adjustment or a broader shift in supply and demand, one must cross-reference index figures against actual contracts.
The coexistence of H100's $2.80 neocloud rate and $7.19 hyperscaler rate illustrates this point clearly. Even for the same H100, the hourly rate a renter pays changes depending on network, region, and procurement terms. Placing B200's $5.66 alongside H100 and A100 figures doesn't by itself constitute a comparison of generational performance differences, residual value, or each provider's profitability.
At the same time, the index itself carries real value. Silicon Data positions this data as a benchmark for procurement, contract standard-setting, and capacity planning. Tracking which generation and which delivery format saw rate movement can serve as a starting point for deciding whether it's time to expand GPU capacity or reconsider long-term contract terms.
What Actually Changes Useful Life Is an Assessment of the Asset Pool
Accounting depreciation sits in seemingly adjacent territory to these price indices, but the unit of judgment differs. In January 2025, Meta assessed certain servers and networking assets and extended their estimated useful life to 5.5 years, effective from the start of fiscal year 2025. The company disclosed that, for assets already in service by the end of 2024, this would reduce 2025 depreciation expense by approximately $2.9 billion.
What Meta identified as the target here was "certain servers and networking assets"—not a specific GPU generation. The disclosure also contains no explanation grounded in the hourly rental rate of individual GPUs. Rising GPU rental rates can serve as one piece of evidence that usage will persist. Still, that is not the same thing as a decision to change the useful life of an asset pool.
Microsoft similarly assessed servers and network equipment in July 2022 and extended their useful life from 4 years to 6 years. The reasons the company cited were investments in software that improves operational efficiency and technological advances—not an explanation citing individual GPU rental rates. Changes to useful life are disclosed as an assessment of the entire equipment base, including how the technology is used.
Treating rising prices alone as a tailwind for depreciation blurs the actual issue at hand. What GPU-holding operators need to verify isn't the quoted price, but rather how long, at what utilization rate, and at what realized rate they can run their equipment after signing a contract. The workload individual GPUs process also isn't uniform across generations.
Only Contract Rates and Workload Together Tell the Full Story
Therefore, the fact that the B200 index sits at $5.66 per hour isn't a figure that directly supports the conclusion that spending on AI compute resources remains robust. Rather, it's evidence confirming that prices diverge by generation and sales channel, and that environmental conditions factor into any unit-price comparison. The short-term rise in the neocloud H100 index and the year-to-date rise in the B200 index should be read as separate movements, rooted in different index categories and standardization conditions.
To track the true value of GPUs, one needs to start with the daily index and then overlay each company's long-term contracts, equipment utilization, and revenue-generating workload. Only then can one place, on the same map, both how much older GPUs continue to contribute to revenue and whether the accounting useful life applied to them is reasonable.