

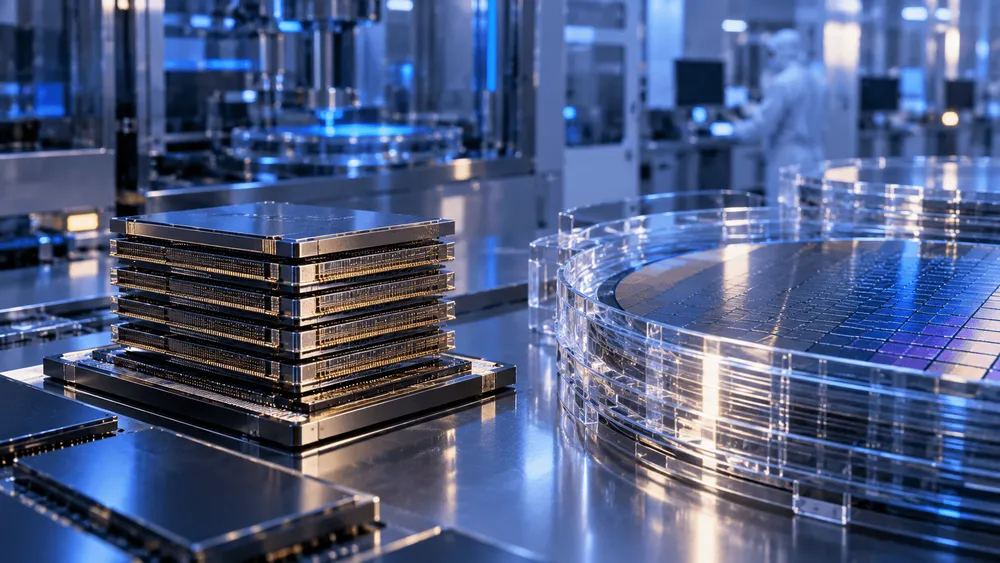
Reports have emerged suggesting Samsung Electronics ('Samsung') plans to at least double production of HBM4 and next-generation HBM4E by 2027. On September 20, 2026, Seoul Economic Daily cited semiconductor industry sources saying Samsung intends to increase outsourced cleaning of glass carriers used in HBM processes from 20,000 sheets per month to 50,000 sheets per month. However, this 50,000-sheet figure is not an officially announced finished-product production target from Samsung. While the large number signals movement toward increased production, understanding actual HBM4-series shipment volumes requires separating wafer input volume, product mix, and yield rate as distinct factors.
Three Numbers Behind the 2027 Production Increase Speculation
The first figure to emerge from Seoul Economic Daily's exclusive report concerns the number of glass carriers sent out for cleaning. Reportedly at 10,000 sheets per month in 2025 and 20,000 sheets per month in 2026, this is expected to rise to 50,000 sheets per month by 2027—a 2.5x increase from 2026, and a 5x increase over two years.
Glass carriers are support structures temporarily bonded to the back of HBM DRAM wafers during thin grinding and processing, preventing warping and breakage. After processing, they are removed, cleaned, and reused. As HBM stacking increases, individual DRAM dies must be made thinner to fit within fixed package thickness constraints, making carrier-related process activity a useful indicator of production preparation.
The same report also cited industry forecasts that Samsung's average monthly wafer input across all HBM production would rise from approximately 180,000 sheets in 2026 to approximately 250,000 sheets in 2027—an increase of 70,000 sheets, or roughly 38.9%. Additionally, the proportion of HBM4 and HBM4E within total HBM shipments is expected to rise from approximately 40% to approximately 80%—a 40-percentage-point increase, or a doubling in terms of composition ratio.
All three figures point toward increased production. However, they are not measuring the same thing. The cleaning volume reflects process activity related to handling support structures; wafer input volume reflects total front-end input across all HBM; and the 80% figure represents the proportion of next-generation products within finished-product shipments.
A 2.5x Increase Doesn't Mean 2.5x Finished Products
While outsourced glass carrier cleaning volume is projected to increase 2.5x from 20,000 to 50,000 sheets per month between 2026 and 2027, total HBM wafer input is projected to rise by only about 38.9% (from 180,000 to 250,000 sheets), and the HBM4-series shipment composition ratio is projected to rise 40 percentage points (from approximately 40% to 80%)—these are separate metrics. Since reuse frequency, process input methods, and yield rates remain undisclosed, none of these figures alone translates into a finished-product output multiplier.
| Metric | Process/Denominator Measured | 2026 | 2027 Forecast | Range of Interpretation |
|---|---|---|---|---|
| Outsourced glass carrier cleaning volume | Number of outsourced cleaning cycles for reusable support structures | 20,000 sheets/month | 50,000 sheets/month | 2.5x increase. Indicates expanded process activity but cannot be converted into good-die stack count |
| HBM wafer input volume | Average monthly input across all of Samsung's HBM production | ~180,000 sheets | ~250,000 sheets | ~38.9% increase. Represents total front-end input volume, not specific to HBM4-series alone |
| HBM4-series shipment composition ratio | Proportion of HBM4 and HBM4E within total HBM shipments | ~40% | ~80% | 40-percentage-point increase. Reflects product mix in shipments, with a different denominator than wafer count |
| Product stage | Officially confirmed status by Samsung | HBM4: mass production and commercial shipment underway; HBM4E: samples shipped | HBM4E mass production start date not yet announced | Gap remains between production readiness and actual shippable good-unit volume, pending optimization and customer scheduling |
For example, if the number of times a single carrier is reused increases, the cleaning volume figure would rise faster than the actual number of new carriers in use. Simply changing the outsourcing ratio would also move this metric. Conversely, even if wafer input increases, a decline in yield rate could cause growth in shippable good units to fall below input volume growth. The source report itself notes that carrier usage volume varies depending on process input methods and yield rates.
Therefore, the 50,000-sheet figure is not meaningless—it does signal that Samsung is moving to substantially scale up HBM4-series processes. However, without knowing how many times each carrier is reused, how many wafers are processed, and what proportion become good units, this figure cannot serve as a conversion factor implying finished products will increase 2.5x.
From 180,000 to 250,000 Sheets: A Product-Mix Shift Larger Than Total Volume Growth
The forecast that total HBM monthly input will rise from 180,000 to 250,000 sheets indicates overall HBM wafer input volume growing by approximately 38.9%. Meanwhile, the HBM4-series shipment composition ratio is expected to rise from approximately 40% to 80%. The changes anticipated in 2027 are more accurately understood not just as overall volume expansion, but as a shift in production and shipment focus from older generations toward HBM4 and HBM4E.
It would be incorrect to multiply 250,000 sheets by 80% to estimate HBM4-series input at 200,000 sheets per month. The denominator for the 250,000-sheet figure is wafer input, while the denominator for the 80% figure is finished-product shipments. If die capacity, stacking count, and yield rates differ by product, the number of stacks obtainable from a single wafer would also vary. Samsung has not disclosed product-specific input volumes or good-unit counts.
Samsung itself indicated in February 2026 that it expects 2026 HBM revenue to exceed three times that of 2025. This, too, does not necessarily mean shipment volume will triple—revenue figures are also affected by pricing and shifts toward higher-value-added products. Bundling together a 2.5x increase in cleaning volume, a revenue increase exceeding 3x, and a 38.9% increase in input volume as a single 'production increase rate' risks losing sight of exactly which process is increasing by how much.
HBM4 Already in Mass Production, HBM4E Still at Sample Stage
Regarding HBM4, Samsung announced on February 12, 2026 that it had begun mass production and commercial shipments to customers. The 12-layer product offers 24-36GB capacity, with a guaranteed operating speed of 11.7Gbps and a maximum of 13Gbps. It combines sixth-generation 10nm-class DRAM ('1c') with a 4nm-process logic base die. Samsung also indicated plans to expand to a 16-layer version offering up to 48GB.
HBM4E's status differs. Samsung announced on May 29 that it had shipped 12-layer, 48GB samples to major global customers. Guaranteed operating speed is 14Gbps with a maximum of 16Gbps, and single-stack bandwidth is stated at up to 3.6TB/s. However, mass production has only been described as beginning after sample shipment and customer-specific optimization, aligned with customer schedules—no fixed start date has been announced. Sample shipment is not synonymous with completing customer qualification or beginning mass-production shipments.
This difference in product stage directly affects the uncertainty surrounding 2027 forecasts. HBM4 already has an established mass-production track record, with a pathway already in motion connecting capacity expansion to shipments. For HBM4E, even with production capacity prepared, commercial shipment cannot occur without passing customer evaluation and scheduling. In its Q2 2026 earnings, Samsung explained that amid limited capacity, it prioritized server-oriented products and expanded HBM4 sales. The company anticipates that supply constraints will continue in the second half even after production increase efforts.
What Comes After Carrier Volume: The Conversion Rate in Question
Confirming whether the 'at least doubling' figure for 2027 materializes requires more than just executing the 50,000-sheet cleaning plan. Knowing the reuse frequency per carrier and the outsourcing ratio would bring cleaning volume figures closer to reflecting actual process load. If product-specific wafer input volumes, yield rates, and good-stack counts for HBM4 and HBM4E were disclosed, the conversion rate from input to shipment would also become visible.
For HBM4E, completion of major customer qualification and the start of mass production represent another key milestone. Furthermore, confirming whether the HBM4-series actually reaches 80% of total HBM shipments in 2027 would allow verification of whether growth in total input volume or the generational product-mix shift was the primary driver behind increased shipments. Glass carriers serve as a leading indicator that quickly reflects activity within the factory. Whether this translates into a doubling of finished products will ultimately be determined not by the number of reused support structures, but by the conversion rate—the proportion of input wafers that become certified good units.