


Anyone with solar panels on their roof has probably scratched their head at least once while looking at the generation graph in a monitoring app. In August, when sunlight should be at its strongest, output doesn't grow as much as expected compared to May or June. Some days, even during a stretch of clear skies, generation is actually lower than the day before.
Sunlight itself remains at a high level throughout the year from June to August. Because the sun reaches its highest point in the sky and clear days last longer, the total energy the ground receives actually increases. Yet the crucial figure—power output—doesn't rise as straightforwardly as sunlight does.
The cause of this summer-specific shortfall isn't clouds or dirt on the panels. It's a property inherent to the panels themselves: they are vulnerable to heat. Solar panels are semiconductor devices that convert light into electricity, and semiconductors lose performance as temperature rises. This article unpacks the physical mechanism behind this and explains why the performance figures manufacturers list in their catalogs are based on a "25°C" standard.
Sunlight Increases, But Output Shrinks
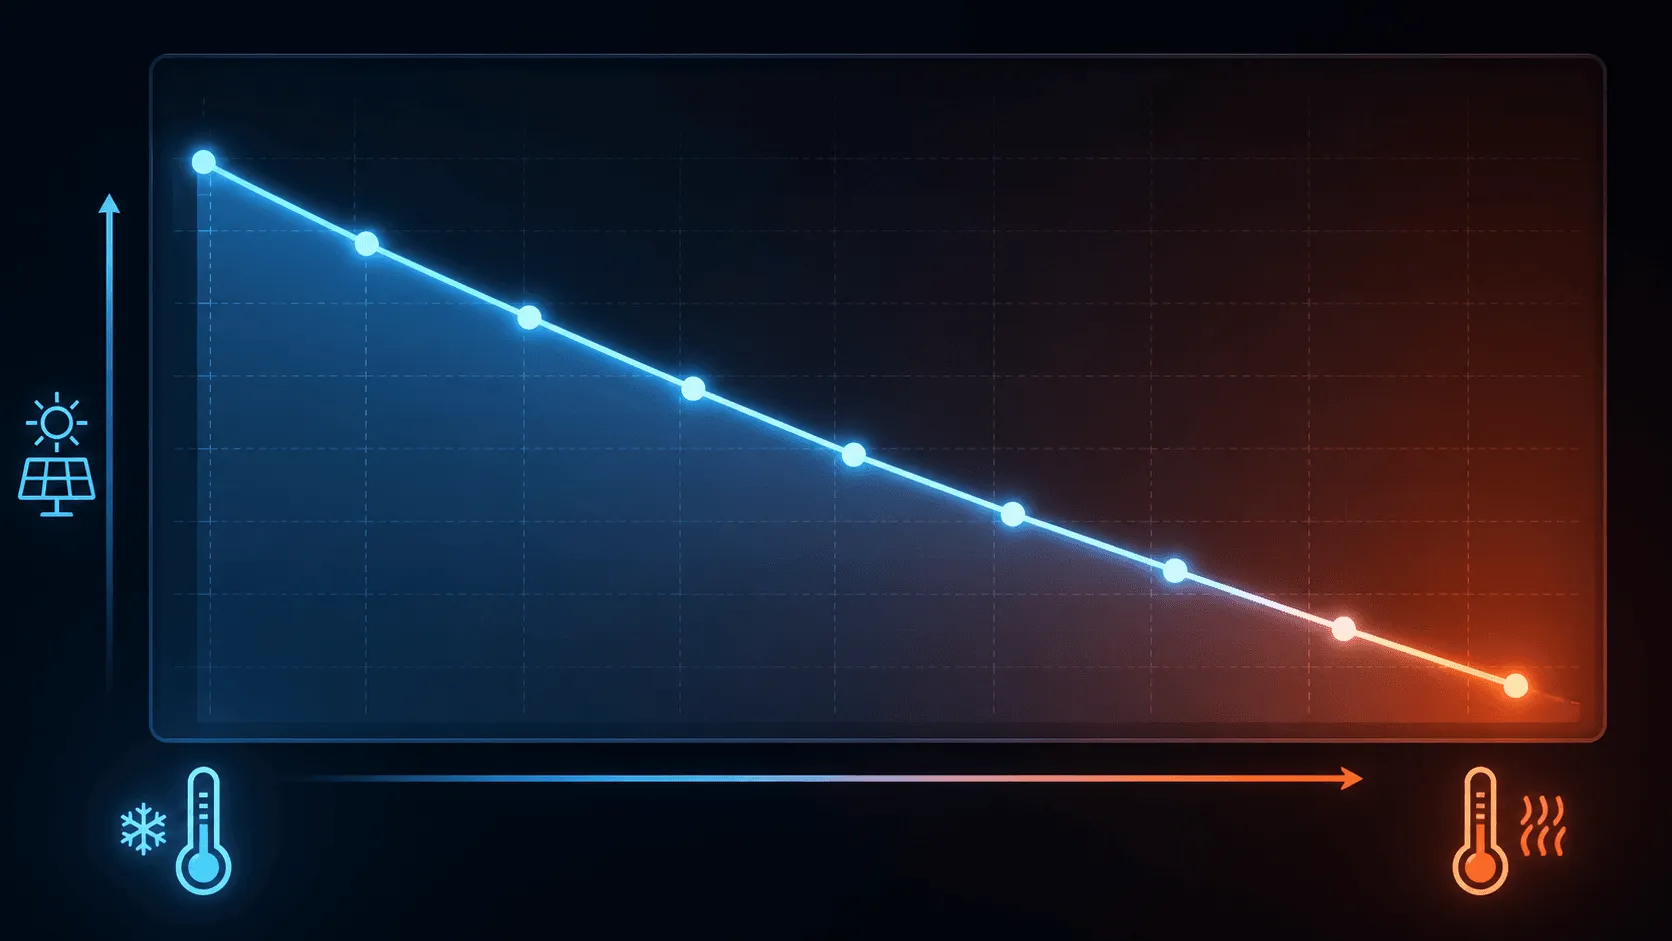
The maximum output of a crystalline silicon solar cell drops by 0.4–0.5% for every 1°C rise in panel temperature. This figure is called the "temperature coefficient," and it represents the standard value for crystalline silicon cells as explained by PVEducation, an educational and research resource on photovoltaics. The baseline is 25°C—the cell junction temperature defined by the international Standard Test Conditions (STC) used to measure panel performance. The "rated output" listed in catalogs is also a figure measured under these conditions.
Under the blazing sun of midsummer, panels almost never stay at 25°C. Actual panel temperature can be estimated using a figure manufacturers publish called the "Nominal Operating Cell Temperature" (NOCT). NOCT is measured under conditions closer to reality—800 W/m² of sunlight, 20°C ambient temperature, and 1 m/s wind speed—and for crystalline silicon panels, this typically falls in the range of 40–48°C. From this, the actual cell temperature can be roughly calculated by adding (NOCT − 20) × (irradiance / 800) to the ambient temperature.
Assuming a scorching Japanese summer day—35°C ambient temperature, 1,000 W/m² of sunlight (a peak value under clear skies), and a standard NOCT of 45°C—the cell temperature jumps to roughly 66°C, calculated as 35 + (45−20) × (1000/800). That's 41°C above the 25°C baseline. Multiplying this gap by the temperature coefficient of 0.4–0.5% means that even under equally strong sunlight, heat alone can wipe out roughly 18.5% of the catalog-rated output. In other words, this loss can end up swallowing whatever gain came from increased sunlight.
The Real Culprit Behind the Output Drop: Voltage
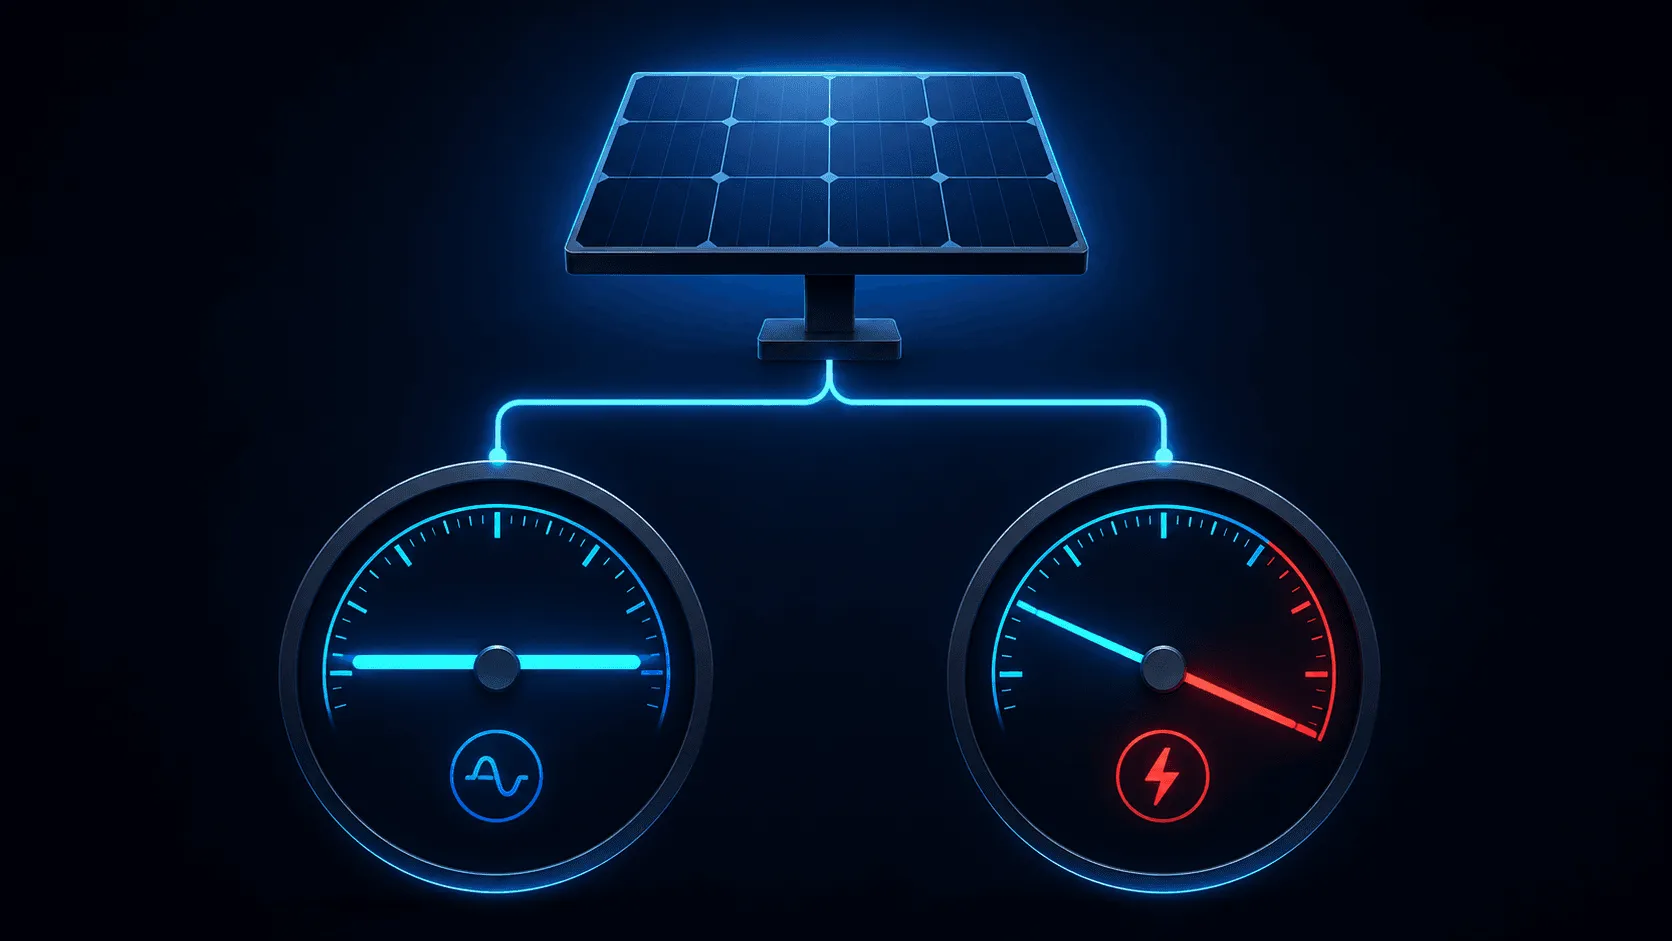
A solar panel's power output is determined by the product of current and voltage (P = IV). It's tempting to assume that rising temperature reduces output by lowering current, but in reality the main culprit is the opposite. Current actually increases slightly as temperature rises. According to PVEducation's data, this increase amounts to only about 0.06% per degree Celsius. This happens because semiconductors become better at converting light into electricity as they heat up, allowing them to convert even longer-wavelength light—previously unabsorbed—into electrons.
What actually drags output down is open-circuit voltage (Voc). According to PVEducation, the open-circuit voltage of a crystalline silicon cell drops by about 2.2 mV per degree Celsius. Behind this lies a property in which the faint leakage current flowing inside the semiconductor roughly doubles for every 10°C rise in temperature. Even without light hitting the panel, more electrons move around due to thermal energy, and this leakage pushes voltage down. While current barely changes, voltage keeps falling—and since output is the product of the two, it declines steadily as temperature rises.
"25°C" Was Always Just a Yardstick for Comparison
The 25°C defined by STC isn't meant to replicate real-world usage conditions—it's a yardstick for comparing different manufacturers and different products on equal footing. A report from the U.S. Department of Energy also introduces another benchmark alongside STC: "PTC" (PV USA Test Conditions). PTC is measured under conditions closer to actual operating environments—20°C ambient temperature and 1,000 W/m² of sunlight—and typically yields lower output figures than STC.
Sinovoltaics, a website focused on solar panel quality, points out that a situation in which a panel is exposed to STC-level sunlight of 1,000 W/m² while its temperature is somehow held at 25°C almost never happens in real-world operation. In other words, the "rated output" printed on a catalog isn't a number a panel can actually achieve on a rooftop in midsummer. It's a figure that only holds up under the shared rules established for comparison purposes.
How this physical reality is mitigated also depends on the panel's generation. According to calculations by standard-project.net, a solar power information site, relatively newer generations of cells have a temperature coefficient of around -0.27 to -0.30%/°C, making them more heat-resistant than conventional cells (around -0.40%/°C). At a panel temperature of 70°C, newer-generation cells retain about 86.5% of their rated output, while conventional cells drop to around 82%—a gap of roughly 4 to 5 percentage points. The temperature coefficient listed on a panel's spec sheet is a practical indicator that reflects not just normal-condition performance, but also how much generation is likely to shrink during the summer.
The next time you check the generation graph on your home monitoring app, it's worth glancing not just at the sunlight curve but also at that day's temperature. The hotter the day, the less a panel is able to deliver its true potential, even under identical sunlight. Behind every day when the numbers fall short lies a panel working away on the roof at temperatures well above 60°C.