


On November 16, 2026, Moth Quantum announced Tessa, a method that uses the whole of IBM's 120-qubit device "Phoenix" to encode 1,568 real numbers representing a color image and read them back. In the experiment, each pixel of a 28×28 image was converted into numerical values for brightness and hue, which were then encoded into qubits.
Tessa exploits the physical connectivity between qubits to load a large number of values into a quantum processor. However, how many values can be encoded is a separate question from whether they can be read back accurately. In Tessa, the same quantum circuit is prepared and measured repeatedly, and individual values are estimated from the resulting probabilities. The more values are encoded, the more the number of measurements needed for readout matters.
Tessa uses qubit connectivity
The results are described in a paper by Daniel Bultrini of Moth Quantum, "Tessa: Encoding Classical Data Across an Entire Quantum Processor." It was published on November 13 as arXiv:2611.18440v1 and is currently a preprint that has not been peer reviewed.
Tessa divides qubits into data qubits, which hold the numbers, and address qubits, which specify the positions of those numbers. Each data qubit rotates according to the combination of states of its neighboring address qubits, and the number is encoded in the rotation angle. For example, four neighboring address qubits yield 2^4 = 16 state combinations, so a single data qubit can encode 16 values.
In the earlier QPIXL, a shared group of address qubits was connected to a single data qubit, and QCrank let multiple data qubits share that address group. Tessa, by contrast, restricts the address qubits used to control each data qubit to its neighbors, and some of these are shared between neighboring data qubits. This makes it possible to encode many values along the actual wiring of the chip, without SWAP gates, which move states between distant qubits, or additional auxiliary qubits.
The experiments used Phoenix, a 120-qubit device with qubits arranged in a square lattice, and Fez, a 156-qubit device with a heavy-hex lattice. When one value was encoded per pixel, Phoenix handled 784 values and Fez 441. With a scheme that encodes two values per pixel, using brightness as the polar angle and hue as the phase, these rose to 1,568 and 882 respectively.
In the earlier QCrank experiment that Bultrini used as a comparison, 12 qubits were used to encode and read back 128 values. However, this comparison is limited to the condition of "writing an arbitrary sequence of real numbers to an actual quantum processor and reading back each value." It differs from studies that feed in an image and return only a classification result, or that reconstruct an image from a learned approximate representation, so the number of values alone cannot establish superiority in reconstruction quality or processing speed.
Measurement counts govern reconstruction accuracy
When many values are encoded in combinations of address-qubit states, measurement results are distributed among those combinations. With four neighboring address qubits, 8,192 measurements are split across 16 states, giving an average of about 512 samples per value. Substituting N=8,192 and m=4 into the ideal sample-count formula N/2^m in Section 2.3 of the paper gives 8,192 ÷ 16 = 512.
Bultrini explains that Tessa's readout cost is determined mainly by the number of measurements. The leading term of the sampling error in angle estimation is proportional to 2^{m/2}/√N. Halving the error with the same number of address qubits requires about four times as many measurements, and maintaining accuracy while adding one address qubit requires about twice as many. However, this relationship concerns ideal sampling error and does not represent the total error including real-device noise and correction processing.
In the main image experiment, conducted on September 26, 8,192 measurements were taken for each measurement basis. One-value encoding used only the Z basis, for a total of 8,192 measurements. Two-value encoding estimates brightness and hue using the Z and X bases, so it required 16,384 measurements in total.
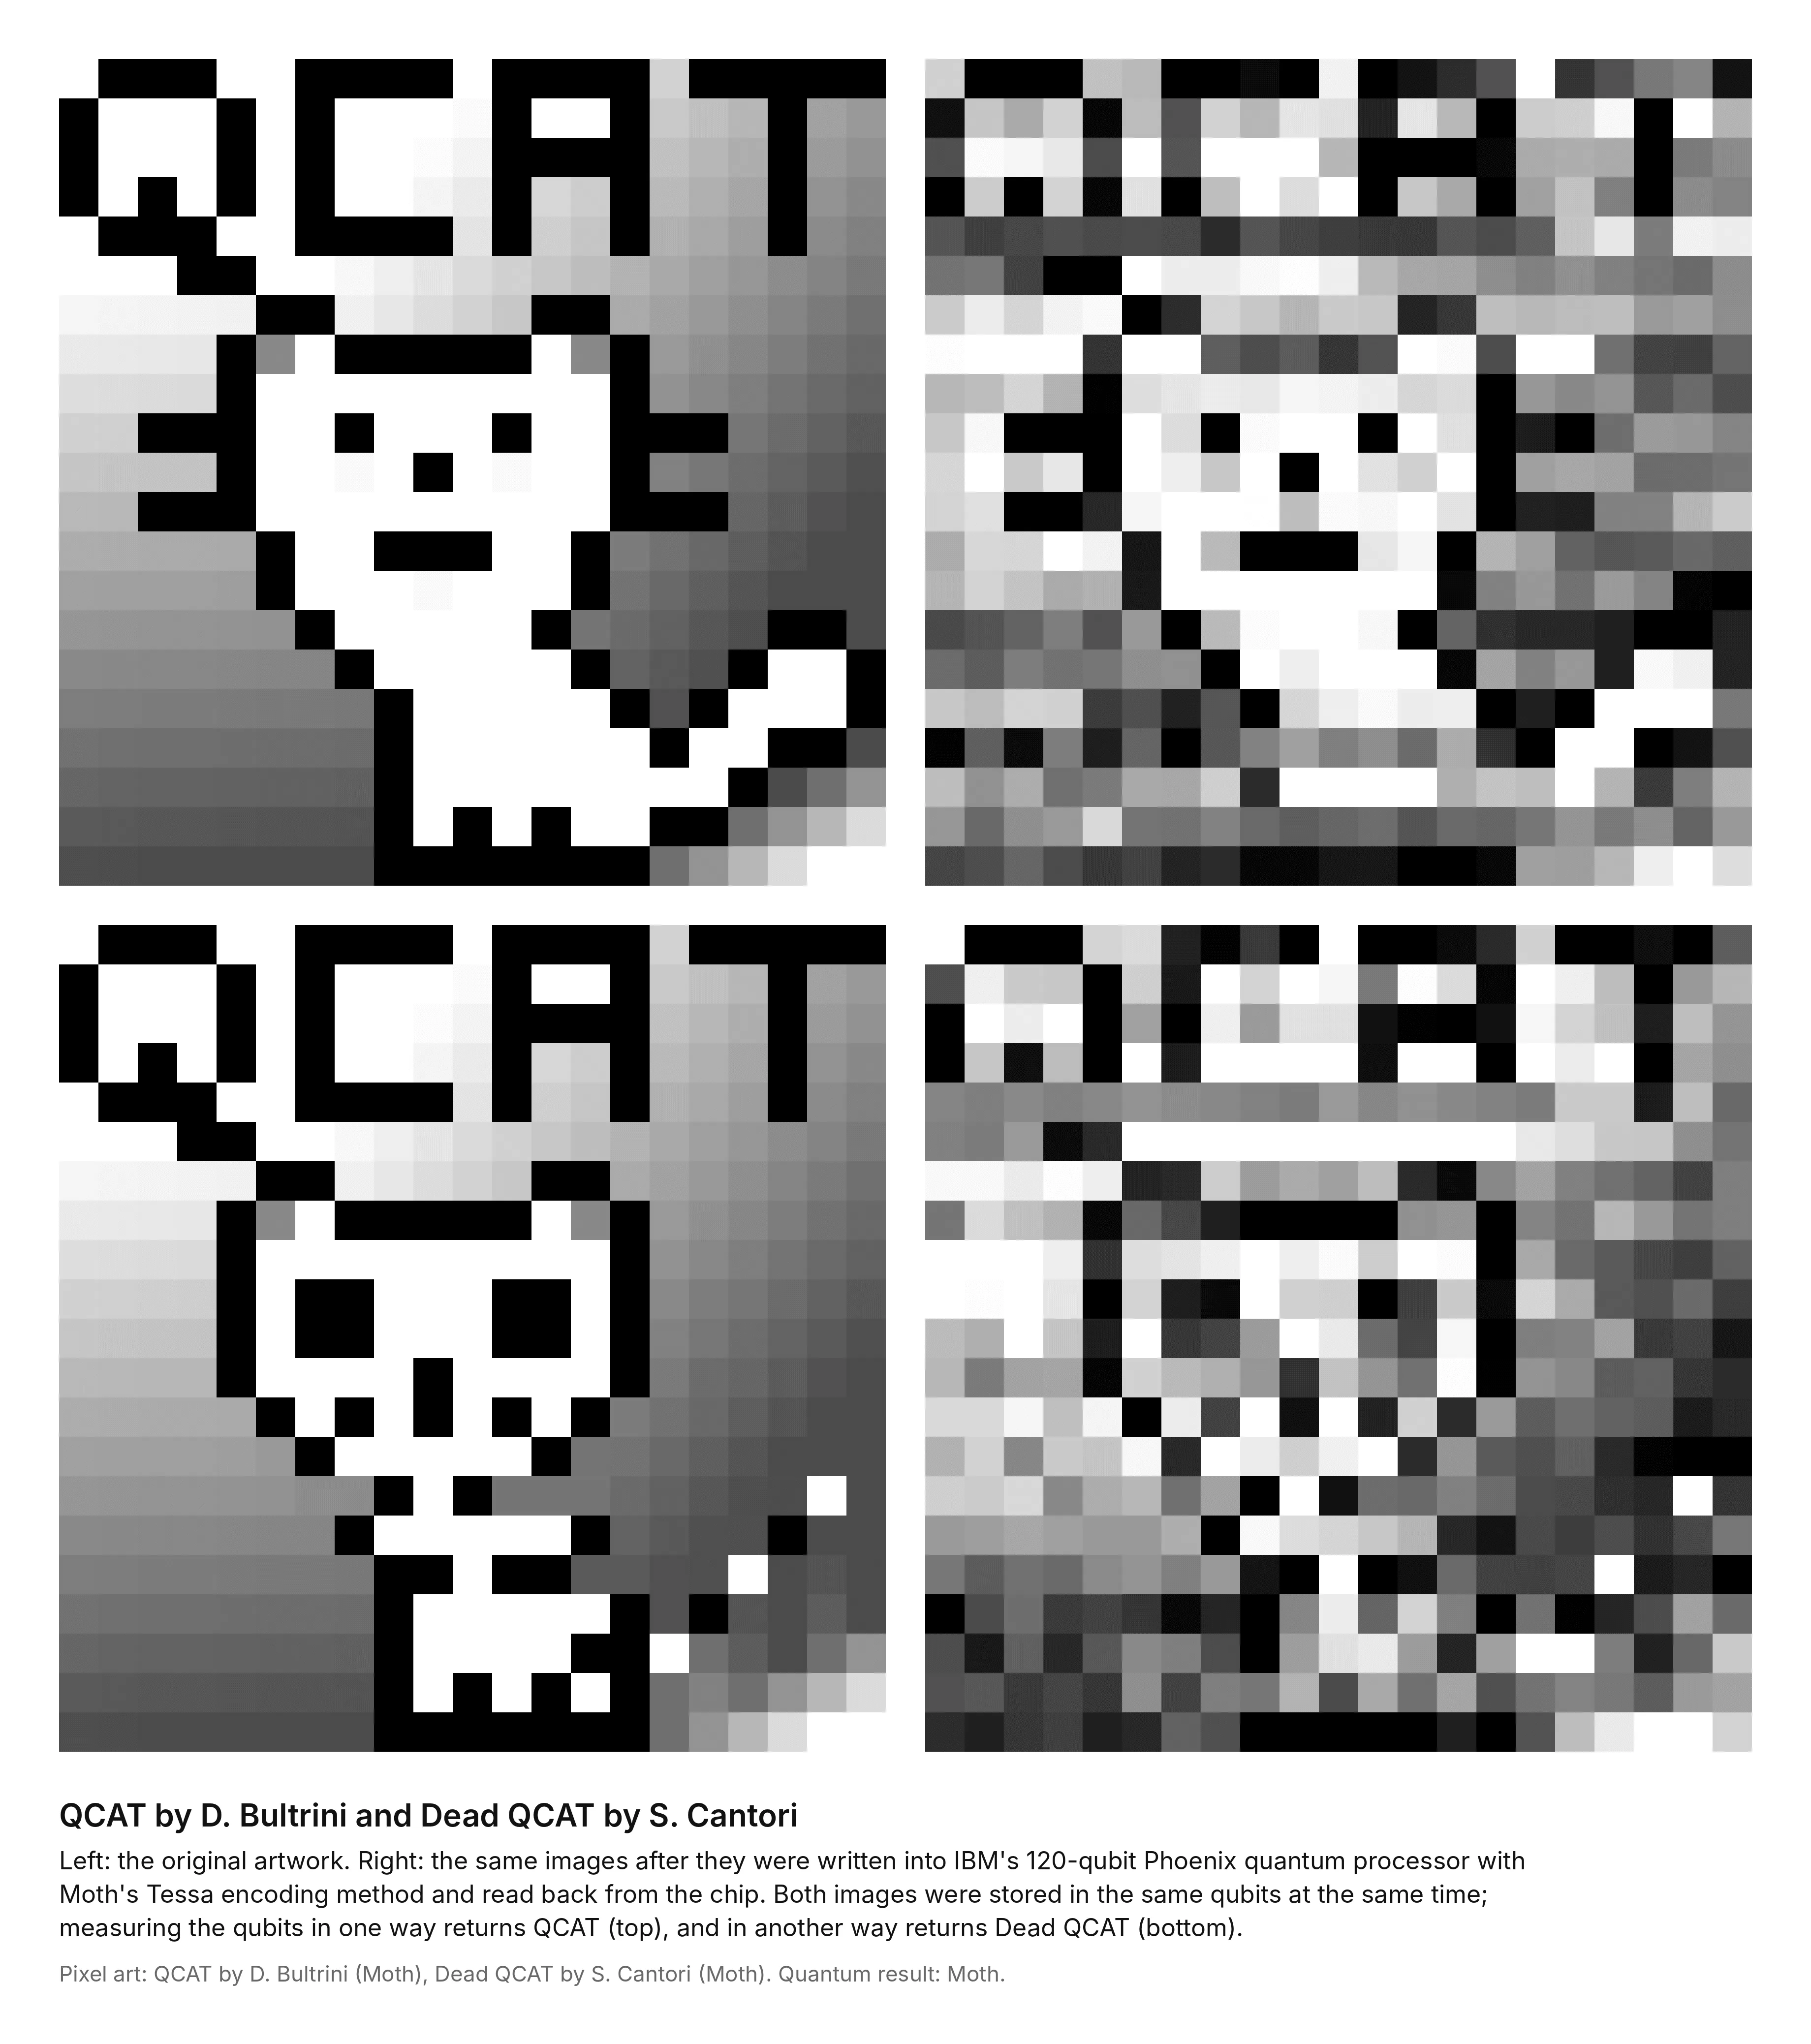
The results of experiments using the same QCAT image, from Table 1 of the paper, are as follows.
| Condition | Values | Mean absolute error (uncorrected) | Mean absolute error (corrected) | Correlation coefficient |
|---|---|---|---|---|
| Phoenix hardware, 1-value encoding | 784 | 0.130 | 0.075 | 0.96 |
| Local noise simulation, 1-value encoding | 784 | 0.104 | 0.059 | 0.97 |
| Phoenix hardware, 2-value encoding | 1,568 | 0.152 | 0.154 | 0.69 |
| Local noise simulation, 2-value encoding | 1,568 | 0.059 | 0.048 | 0.94 |
Notes: Mean absolute error is evaluated on a 0–1 scale. The error and correlation coefficient for 2-value encoding refer to brightness and do not include hue error. Each measurement basis used 8,192 measurements. The correction used the mean and standard deviation of the original image.
Mean absolute error expresses the deviation between the original values and the reconstructed values, while the correlation coefficient indicates how well the two correspond. A correlation coefficient of 0.96 does not mean that 96% of pixels matched exactly. In the 1,568-value hardware experiment, the brightness correlation coefficient was 0.69.
The correction method also requires caution. The dynamic-range correction used in the experiments is a classical process that adjusts the distribution of the read-back values using the mean and standard deviation of the original image. Quantum error mitigation was not used. This correction improved the mean absolute error for one-value encoding on hardware from 0.130 to 0.075, but for two-value encoding it went from 0.152 to 0.154, a slight worsening.
The simulations compute subcircuits made up of each data qubit and its neighboring address qubits and add noise based on the device's calibration data. This approach omits effects such as interference from qubits outside the subcircuit. For two-value encoding in particular, there is a large gap between the simulated and hardware errors, and the author points out the limitations of the local noise model. However, these results alone do not identify how much each individual error source contributed.
Recovery accuracy differs sharply between DNA and proteins
In images, a visual character can survive even when numbers drift somewhat, but in DNA and protein sequences, a small error can lead to one symbol being mistaken for another. In the biological sequence experiments conducted on October 16, 32,768 measurements were taken per measurement basis on Phoenix. DNA and RNA were treated as four known nucleotide symbols, and proteins as 20 known amino acid symbols.
The spherical-arrangement scheme used in the experiments places candidate symbols on the Bloch sphere, which represents a qubit's state, and picks the candidate closest to the results obtained from the Z, X and Y measurement bases. Encoding one symbol per position requires distinguishing 4 or 20 states, and encoding two symbols requires distinguishing 16 or 400. As the number of candidates grows and the distances between states shrink, measurement error makes it more likely that a different symbol is chosen.
According to Table 8 of the paper, when 784 bases of DNA from the human mitochondrial gene MT-CO3 were encoded at one symbol per position, the symbol match rate on hardware was 92.1% uncorrected and 92.3% with the best correction. By contrast, when 1,582 residues of the protein SUR1 isoform 2 were encoded at two symbols per position, the match rate stayed at 21.0% to 22.6%. The best correction result here means the value from whichever correction method gave the highest match rate when checked against the original correct sequence.
This difference in accuracy cannot be explained by sequence length alone. In an experiment encoding POLG2 messenger RNA, also 1,582 characters, at two symbols each, the symbol match rate was 83.8% uncorrected and 84.3% after correction. Even with sequence length and encoding method matched to SUR1, the number of candidates to distinguish differs greatly between four nucleotides and 20 amino acids. However, these experiments also differ in symbol type and sequence content, so they are not comparisons that isolate the effect of any single condition on accuracy.
For the spherical-arrangement scheme on SUR1, noiseless simulation gave a 100.0% match rate. Simulation with added noise gave 63.7% uncorrected and 69.5% with the best correction, but hardware stayed at 21.0% to 22.6%, a large gap. The author points out that the simplified noise model may not adequately reproduce real-device errors. Note that what these experiments evaluated was whether sequence data could be accurately reconstructed, not the biological function of the DNA or proteins.
The next question is usefulness across a whole computation
In Appendix D, the paper explains that if Tessa were used as a memory device from which all encoded values are read back, the burden of repeated measurement would be heavy and classical memory would be superior. The envisioned use is a computation that operates on the encoded quantum state and reads out only a small result at the end. What needs evaluating is not just how many values can be encoded but the processing load required to obtain the desired computational result.
Some of the materials needed for verification have already been released. Moth Quantum's GitHub repository contains Tessa's implementation code, the hardware measurement data for images and biological sequences, the quantum circuits, and notebooks that regenerate the paper's figures and tables. Reanalyzing the saved data does not require an IBM account, so the paper's numbers can be checked. However, reanalyzing existing data is not the same as reproducing the same results on a different quantum processor. In the public information confirmed so far, no results from independent hardware replication have been found.
To judge practicality, it will be necessary to establish correction methods that work on unknown inputs whose original images or sequences are not known, and to examine whether the desired results can be obtained in actual quantum computations. In these experiments, corrections using the original data and selection of correction methods were performed, and the local noise model and hardware results also differ. With these conditions sorted out, the next challenge in assessing Tessa's uses is evaluating the whole pipeline, including the quantum gates, measurement counts and classical processing needed from data encoding through to reading out the computational result.