

UCLA's Robert Fairlie and Jane Wu examined whether the spread of AI has worsened employment outcomes for new U.S. college graduates, using unemployment rate data. Their CESifo Working Paper No. 12994, dated September 15, 2026 (a pre-peer-review working paper), analyzed 22-25 year-old college graduates using microdata from the Current Population Survey (CPS, the U.S. monthly labor force survey) and reported a June-August 2026 unemployment rate of 7.3%.
The corresponding summer rates for 2022 through 2025 were 7.1%, 6.3%, 7.8%, and 7.2% respectively — meaning the 2026 figure of 7.3% falls within the range observed over the past four years.
Furthermore, interaction terms combining occupation-level AI exposure with summer 2026 were not statistically significant across all eight estimation specifications. What did show a clear difference, however, was whether or not an occupation was suited to remote work.
16 Months Since the Warning That 'Half of Entry-Level White-Collar Jobs Could Disappear'
The backdrop against which this paper was tested is a string of statements by business leaders about AI and new graduate employment.
On May 28, 2025, Anthropic's Dario Amodei warned that AI could eliminate half of entry-level white-collar jobs, a warning reported by Fortune. Since then, the impact on new graduate employment has become a major point of debate among executives and investors.
On March 18, 2026, it was reported that BlackRock's Larry Fink said this year's college graduates entering the labor market could face the highest unemployment rate in recent years, even without a recession. Meanwhile, on March 31 of the same year, Marc Andreessen said that, at least through December 2025, AI had not yet reached the point where it could actually perform the jobs companies were cutting.
Views continued to diverge afterward.
On May 26, it was reported that OpenAI's Sam Altman said he had expected larger job losses to be occurring by now. On June 2, NVIDIA's Jensen Huang was reported to have dismissed the idea that AI is reducing employment as "complete nonsense." On August 26, Bill Gates was reported to have said he was particularly concerned about young people entering a labor market where entry-level job openings are shrinking.
Over the roughly 16 months between Amodei's May 2025 warning and this paper's publication in September 2026, executive statements split between warning and denial, and empirical research has produced differing results.
Both authors of the paper are affiliated with UCLA; Fairlie is also affiliated with NBER and IZA. CESifo is the publisher of this working paper.
During this period, actual corporate AI usage was expanding rapidly.
In Appendix B, the paper explains why it chose summer 2026 as the point of examination. According to panel data from Ramp, which covers roughly 70,000 companies, the median monthly AI spending per employee more than doubled between December 2025 and July 2026. However, this data is skewed toward VC-backed companies.
Also, output token volume for ChatGPT Enterprise reportedly grew sevenfold between June 2025 and March 2026 (Chatterji et al. 2026).
When it comes to corporate survey figures, it's important to pay attention to what the denominator actually represents.
In a supplementary AI survey conducted by the U.S. Census Bureau's BTOS (Business Trends and Outlook Survey) from November 17, 2025 to February 8, 2026, among more than 117,000 responses, the share reporting that they had "replaced a large number of tasks with AI" rose to 7.0%, up from 2.5% in a similar supplementary survey conducted in early 2024.
However, the denominator for this percentage is limited to companies that have already replaced employee tasks with AI.
Among all responding companies, the share that had replaced any tasks with AI at all did not increase. In other words, this suggests not that a broader range of companies began adopting AI replacement, but that among companies already using AI, the scope of tasks being replaced expanded.
A similar gap appears at the occupation level.
The authors cite Anthropic data (Massenkoff and McCrory, March 2026) showing that in computer and mathematical occupations, up to 94% of tasks could theoretically be performed by AI, while actual AI usage remains at just 33%.
What appears to be happening now is a process in which this gap between "what's theoretically possible" and "what's actually being used" is narrowing.
Why Compare Summer to Summer, Not Year-Over-Year by Month
The analysis used CPS basic monthly microdata from January 2022 through August 2026.
The CPS surveys more than 130,000 people every month. The paper narrowed its focus to people aged 22-25 whose highest level of education is a bachelor's degree and who are not currently enrolled in school. Holders of master's, professional, or doctoral degrees were excluded.
The sample size for the main regression analysis ranged from 45,816 to 46,734. For comparisons with older college graduates, the sample ranged from 350,187 to 355,101, and for comparisons with non-college graduates, from 150,488 to 155,408.
Data for October 2025 does not exist because the CPS itself was not conducted that month due to a federal government shutdown, and no retroactive survey was conducted afterward.
Narrowing the sample under these conditions also makes clear which groups are excluded from the analysis.
Among people aged 22-25 whose highest degree is a bachelor's, 22.5% are excluded because they are still enrolled in school. Additionally, 7.1% of those not enrolled are excluded from the analysis because they are not in the labor force.
Across the entire analysis period from January 2022 to August 2026, 5.7% of the remaining sample were unemployed. Additionally, 1.9% were not in the labor force but wanted a job.
The authors also created their own measure — an "extended unemployment rate" — that adds people who currently aren't job-searching but want work to the standard unemployed count. This figure came to 7.6%.
Further, underemployment — including those working fewer than 10 hours a week — was 6.8%, and educational mismatch — including those working in jobs that don't require a college degree — was 14.8%.
The nature of the unemployment also has characteristics specific to new graduates.
Among unemployed new graduates, fewer than 17% had left involuntarily, such as through layoffs; the large majority were people who had not found a job since graduating.
This is precisely the group that matters most for analyzing new graduate employment.
The authors also point out that payroll records and unemployment insurance claims data have difficulty fully capturing people who are newly entering the labor market. This is especially true for unemployment insurance, which is generally targeted at people with some work history who are eligible for benefits.
Seasonality is a critical consideration in the analysis design.
The unemployment rate for young college graduates rises every year in June through August, running about 2 percentage points higher than the roughly 5% average seen in other months. This is because newly graduated young people all begin job searching at the same time, and this peak appears at roughly the same time every year.
For this reason, simply comparing the June 2026 unemployment rate to May 2026 or to a different season wouldn't reveal whether the new graduate job market had actually worsened.
The paper instead compares summer to summer, using both a difference-in-differences approach and an event study.
Difference-in-differences compares the change that occurred around a certain period against the change that occurred at the same time in another group less likely to be affected. The event study looks at differences between a baseline year and each subsequent year. The baseline year chosen was 2022.
The 2026 Summer Unemployment Rate Was 7.3%, Within the Range of the Past Four Years
Looking at the monthly unemployment rate for 2026, it rose from 5.4% in May to 7.8% in June, then fell to 7.4% in July and 6.8% in August.
The June-August average came to 7.3%.
Placed alongside past years, the figures were 7.1% in 2022, 6.3% in 2023, 7.8% in 2024, and 7.2% in 2025. 2026 was lower than 2024 and higher than 2022, 2023, and 2025.
Meanwhile, the January-May unemployment rate was 5.3% in 2026 versus 5.7% in 2025 — actually lower than the previous year.
The authors assess that the summer 2026 unemployment rate falls within the range observed since 2022.
Some English-language articles introducing this paper listed 6.3% as the 2022 unemployment rate. Of the two articles checked, one cited the other, so it's not clear whether both made the same error independently.
According to the paper's text, 6.3% is the figure for 2023, and 2022 is 7.1%.
Mixing up which year corresponds to which value changes the entire impression of whether 2026's 7.3% represents a near-record high or a figure within the normal range of recent years.
- Official unemployment rate
- Extended unemployment rate
データを表で見る
| Official unemployment rate (%) | Extended unemployment rate (%) | |
|---|---|---|
| 2022 | 7.1 | 9.4 |
| 2023 | 6.3 | 9.3 |
| 2024 | 7.8 | 10.1 |
| 2025 | 7.2 | 9.4 |
| 2026 | 7.3 | 10.4 |
The standard unemployment rate has not changed dramatically over the five summers examined. The extended unemployment rate, however, reached 10.4% in 2026 — the highest of the five years.
That said, the gap from the previous high of 10.1% in 2024 is just 0.3 percentage points, and the regression analysis found this difference was not statistically significant.
The additional amount added when including people who want a job but aren't actively searching was 3.1 percentage points in 2026, compared to 2.2 points in 2025.
In other words, in 2026, a higher share of new graduates said they wanted to work but weren't actively job-searching, compared to the previous year.
The regression analysis also found no significant evidence of an unusual worsening specifically in summer 2026.
The coefficient for the summer-2026 dummy variable was -0.008 (standard error 0.007) for the standard unemployment rate and 0.001 (0.009) for the extended unemployment rate. In the event-study specification, the coefficients were 0.001 (0.008) and 0.008 (0.010) respectively.
Three robustness checks — excluding 2025 from the analysis, removing the time trend, and extending the age range to 22-27 — likewise produced no statistically significant results.
Estimates using older college graduates as the control group showed the same pattern.
The "young × summer 2026" interaction term, compared against college graduates aged 30-49, ranged from -0.007 (0.008) to 0.004 (0.010), none of which were statistically significant.
Meanwhile, the seasonal factor itself — "young × summer" — ranged from 0.014 to 0.030 and was significant at the 1% level. In other words, the tendency for unemployment to rise in summer is clearly stronger among young college graduates than among older ones.
Looking at the actual figures, the unemployment rate for college graduates aged 30-49 rose from 2.7% in summer 2025 to 2.8% in summer 2026, while for young college graduates it rose from 7.2% to 7.3%. The gap between the two groups remained unchanged at 4.5 percentage points.
However, a slightly different pattern emerges with the extended unemployment rate.
Young college graduates rose from 9.4% to 10.4%, while older college graduates rose from 4.1% to 4.2%, widening the gap between the two groups from 5.3 to 6.2 percentage points.
The authors themselves caveat that, when viewed through the extended unemployment rate, the relative situation for young college graduates may have worsened somewhat.
In comparisons with 22-25 year-old non-college graduates, the "college × summer 2026" interaction term ranged from 0.002 (0.009) to 0.013 (0.011) — all positive, but none statistically significant.
Looking at the actual unemployment rates, the rate for non-college graduates fell from 7.5% in summer 2025 to 6.8% in summer 2026, while for college graduates it rose from 7.2% to 7.3%. As a result, whereas college graduates had a 0.3-point lower unemployment rate than non-college graduates in 2025, by 2026 they had a 0.5-point higher rate instead.
Even with the extended unemployment rate, the gap by which college graduates were lower than non-college graduates shrank from 2.2 points to 0.3 points — the smallest gap in the five summers examined.
Meanwhile, the overall U.S. employment environment was not deteriorating sharply.
According to BLS's August 2026 employment report, nonfarm payroll employment rose by 162,000, and the unemployment rate held steady at 4.1%. That job growth figure significantly exceeded the average monthly gain of 31,000 over the preceding 12 months.
No Gap by AI Exposure — But a Gap by Teleworkability

The analysis so far has looked at averages across new graduates as a whole.
To examine AI's impact, it's necessary to check whether unemployment moved differently between occupations more exposed to AI and those less exposed.
The paper used two different measures of occupation-level AI exposure.
One is the Anthropic Economic Index (Massenkoff et al. 2026), based on how Claude is actually being used in real jobs — reflecting actual usage patterns.
The other is the Eloundou et al. 2024 index, which had GPT-4 classify O*NET occupational tasks — measuring the theoretical extent to which AI could perform a job.
The former can be thought of as measuring "how much AI is actually being used," while the latter measures "how much AI could potentially be used."
The authors then estimated interaction terms combining summer 2026 with each of these indices.
| Occupational attribute interacted | Interaction coefficient (4 specifications) | Standard error | Significance |
|---|---|---|---|
| Observation-based AI exposure (Anthropic Economic Index) | +0.006 to +0.009 (0.6 to 0.9 points) | 0.007 to 0.008 | Not significant in all 4 specifications |
| Theory-based AI exposure (Eloundou et al. 2024) | +0.008 to +0.012 (0.8 to 1.2 points) | 0.008 to 0.009 | Not significant in all 4 specifications |
| Teleworkability (Dingel and Neiman 2020) | +0.028 to +0.040 (2.8 to 4.0 points) | 0.015 to 0.018 | 2 specifications at the 10% level, 2 at the 5% level |
The coefficients are estimates from a linear probability model; for instance, 0.028 corresponds to a 2.8-point difference in the unemployment rate.
For AI exposure, the interaction with summer 2026 was not statistically significant across all eight estimates, combining both the observation-based and theory-based measures.
By contrast, the interaction with teleworkability was significant across all four specifications, with an estimated gap of 2.8 to 4.0 points. Two specifications were significant at the 10% level, and the other two at the 5% level.
The AI exposure coefficients were all positive, but not large enough relative to their standard errors to reach statistical significance. The estimates also shift depending on the time trend and choice of baseline year.
Note that this analysis only covers respondents who reported an occupation code. Among those classified as unemployed under the standard measure, 15.5% are excluded from the occupation-level analysis; under the extended measure, that figure rises to 35.8%. This point is discussed further below.
Teleworkability is not a measure of whether a person actually worked from home, but rather an indicator of whether an occupation is well-suited to remote work (Dingel and Neiman 2020).
Accounting, clerical work, and software development, for example, are classified as teleworkable occupations, while nursing, cooking, and construction are not.
What's notable is that while the interaction with teleworkability was positive and significant, the coefficient for "summer 2026" itself in the same estimation — that is, the change for occupations not suited to remote work — was consistently negative, ranging from -0.024 to -0.017.
In summer 2026, unemployment among new graduates was relatively higher in occupations suited to remote work and relatively lower in occupations not suited to remote work — the opposite pattern.
However, this cannot be interpreted as "AI's impact has been ruled out and remote work has been proven to be the cause."
This is because jobs highly exposed to AI also tend to be jobs that can be done entirely on a computer — that is, jobs well-suited to remote work.
According to the paper, the correlation between observation-based AI exposure and teleworkability is 0.58, and between theory-based AI exposure and teleworkability, 0.66.
With this much overlap between the indicators, it is difficult to clearly attribute changes in unemployment to AI versus remote work. The authors themselves explicitly state that separating these two explanations is difficult.
Statistical significance also warrants a cautious reading here.
Of the four estimates that were significant for teleworkability, the significance levels were a mix of 10% and 5% — none reached the 1% level.
Also, a result of "not statistically significant" is not proof that "no effect exists." It simply means that, given this sample and estimation method, a clear effect could not be detected.
What Do 19%, 64%, and 7.3% Actually Measure?
Looking only at the numbers, research on AI and new graduate employment might appear contradictory. In reality, though, each study is measuring something different.
| Study | Data source | Population | What it measures | Period covered | Key finding |
|---|---|---|---|---|---|
| Stanford Digital Economy Lab (Brynjolfsson, Chandar, Chen) | Payroll records from payroll-processing firm ADP | 22-25 year-olds in occupations with high AI exposure | Gap between actual employment level and the level expected if it had grown at the same rate as less-AI-exposed peers of the same age | Through June 2026 | About 19% lower (15% in the data as of July 2025) |
| CESifo WP 12994 (Fairlie and Wu) | CPS microdata | 22-25 year-olds, bachelor's degree as highest education, not enrolled | Standard and extended unemployment rates | June-August 2026 | 7.3%, within the range of the past four summers |
| NY Fed Liberty Street Economics (Emanuel, Harrington, Pallais) | CPS microdata | Young college graduates | Share of the rise in unemployment attributable to remote work | Comparing 2017-19 to 2022-24 | 64% |
Stanford's 19% figure represents how far below expected levels employment fell in occupations with high AI exposure, relative to what would have occurred had those occupations grown at the same rate as other occupations.
CESifo's 7.3% is simply the unemployment rate itself for young college graduates.
The NY Fed's 64% is the estimated share of the rise in unemployment among young college graduates, observed over a different period, that can be attributed to the spread of remote work.
Because the units, populations, and time periods differ across these studies, it is not meaningful to directly compare their magnitudes or calculate differences between them.
The conclusions, too, are not as opposed to each other as the headlines might suggest.
The Stanford report explicitly states that it found no evidence of broad-based job displacement across the economy due to AI. It also finds that the changes are occurring not through increased departures of existing employees, but through reduced hiring of new employees.
Fairlie and Wu likewise state that, for new graduates, they found no statistically significant evidence — either in absolute or relative terms — of widespread job displacement or reduced hiring.
Both studies caution that they have not established causality, but rather describe observed patterns.
As a result, the two findings — "employment growth is weaker in occupations with high AI exposure" and "the overall unemployment rate for new graduates falls within the range of recent years" — can both be true at the same time.
Regarding the NY Fed's remote-work explanation and the CESifo paper's significant teleworkability interaction term, it's important not to conflate the time periods involved.
Emanuel, Harrington, and Pallais estimated, in a June 1, 2026 Liberty Street Economics post, that 64% of the rise in unemployment among young college graduates between 2017-2019 and 2022-2024 could be explained by the spread of remote work.
As a possible reason, they suggest that young employees working in person tend to receive more feedback and mentorship from supervisors, and that companies may become more cautious about hiring less-experienced workers in distributed workplaces.
This analysis does not include data from 2026.
The +2.8 to +4.0 point estimate from Fairlie and Wu is a separate analysis focused on summer 2026. For this reason, the NY Fed's "64%" figure cannot be used to explain the situation in 2026.
What can be said is only that two studies, analyzing different periods using different methods, both point in the same direction: employment for young college graduates is weaker in occupations suited to remote work.
Even figures introduced under the same phrase, "new graduate labor market," sometimes rest on different definitions.
In the NY Fed's published analysis of the new graduate labor market, the population covered is people aged 22-27 with a bachelor's degree or higher, and the unemployment rate for the second quarter of 2026 is given as 5.6%, with an underemployment rate of about 42%.
That same page explicitly notes that these figures are not official estimates of the New York Fed, its president, the Federal Reserve System, or the FOMC. The analysis is conducted by two economists, Jaison R. Abel and Richard Deitz.
The age range, education requirements, and definition of underemployment all differ from Fairlie and Wu's study. As a result, it is not meaningful to directly compare 5.6% and 7.3%.
A Key Analytical Weakness: Unemployed Graduates Without Occupation Codes
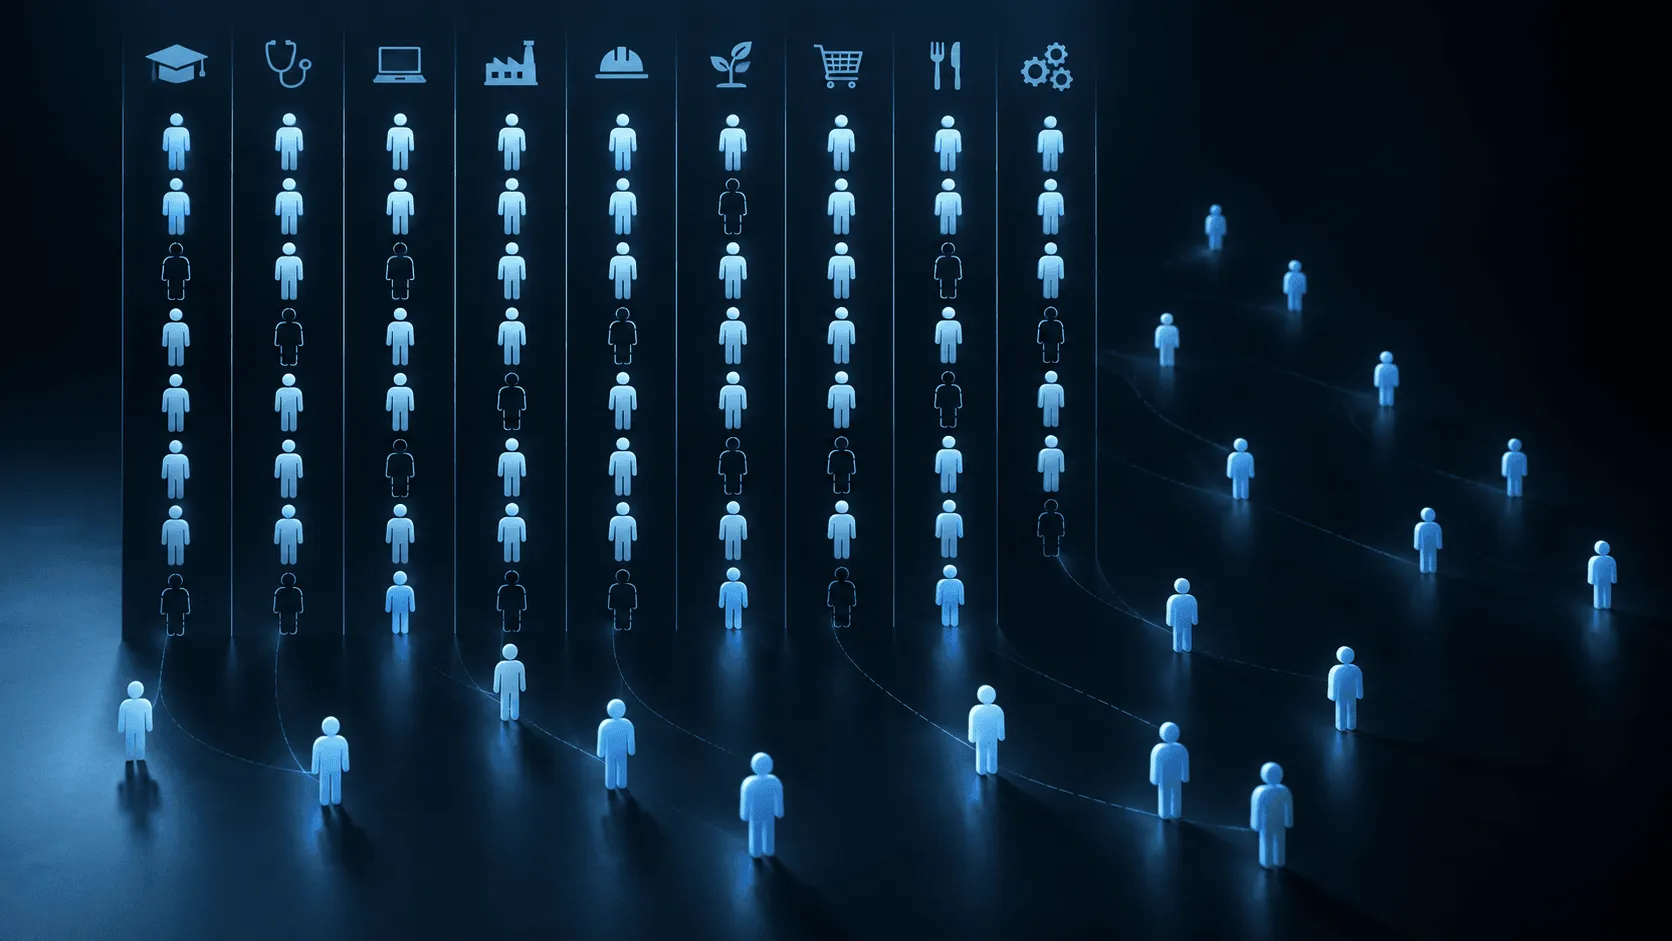
The finding that "the interaction term with AI exposure was not statistically significant" comes with an important limitation that the authors themselves highlight.
In the CPS, occupation codes are assigned only to people who are currently working or who can report on their most recent job.
New graduates who have never found a job since graduating often have little work history and, as a result, may lack an occupation code.
Consequently, 15.5% of unemployed people are excluded from the occupation-level analysis under the standard unemployment measure, and 35.8% under the extended unemployment measure.
This becomes a particularly important issue for analyses that assign AI exposure by occupation.
Suppose a new graduate who had been aiming for a job in an AI-exposed occupation never actually landed a job in that field. Which occupation's unemployment statistics should that person be counted under?
Methods relying solely on CPS occupation codes cannot assign that person to their intended occupation.
The authors note that some of the very people who should be of greatest concern regarding AI's impact may be falling out of the analysis entirely.
This issue could become even larger in studies that rely on occupation-level employment statistics, job posting data, or unemployment insurance claims.
When job postings decline, positions can still be classified by the occupation they were seeking to fill — as long as the posting exists. But if the job postings themselves disappear entirely, a person who had wanted that kind of job may not show up in any occupation's statistics at all.
The authors note several other limitations as well.
This study does not establish causality, nor does it have an ideal control group. It also cannot clearly pinpoint exactly when AI's impact began.
That said, the paper's conclusion does not rule out the possibility of larger effects emerging in the future.
If the scope and frequency of AI use in workplaces continues to increase, graduates from 2027 onward could be more affected than the class of 2026. The authors state that additional annual data will be needed going forward to more clearly determine whether such an impact exists.
It's also an important consideration, when reading these results, that this research is a pre-peer-review working paper.
Japanese readers, too, should be cautious about directly applying these figures to Japan's own new graduate job market.
In the U.S., many people conduct individual job searches after graduating from college, and each summer sees a wave of new job seekers entering the labor market all at once — which is why the unemployment rate shows a peak every summer.
Japan, by contrast, retains the practice of coordinated, en-masse new graduate hiring, and the employment rate for university students graduating in March 2026 stood at a high 98.0%.
The summer rise in unemployment and the weaker employment seen in teleworkable occupations observed in the U.S. cannot simply be transplanted onto Japan's new graduate hiring practices.
The paper itself also points to what should be examined next.
That includes tracking the summers of graduating classes from 2027 onward using CPS data; developing analytical methods that can more clearly disentangle the 0.58-0.66 correlation between AI exposure and teleworkability; and finding ways to incorporate unemployed people without occupation codes into the analysis.
Once these conditions are met, it will become possible to more clearly determine — based on actual data rather than executives' statements — how much AI, versus remote work, is actually affecting new graduates' job opportunities, and to what extent.