

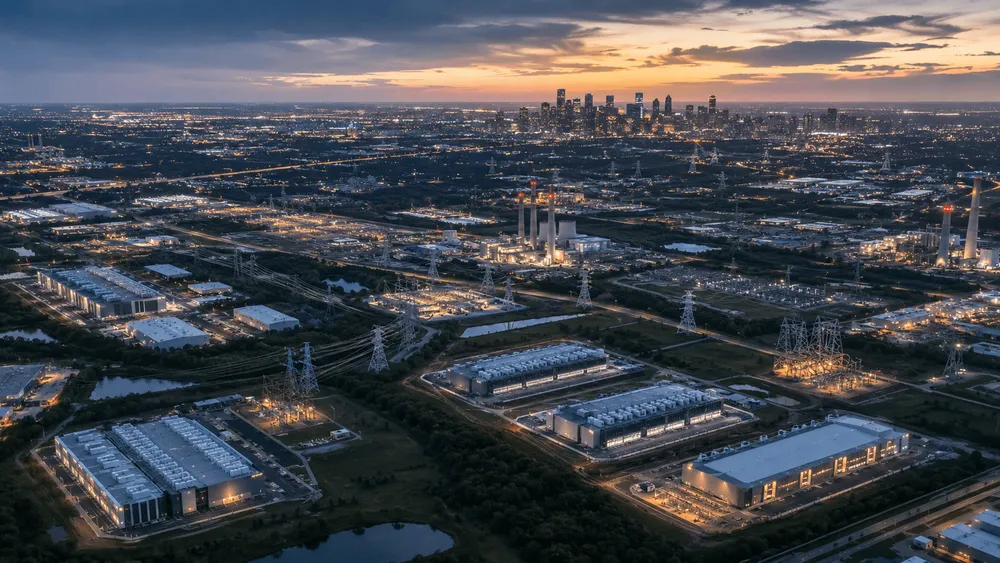
A research team at New York University (NYU) published a paper in Nature Cities on July 31, 2026, analyzing the locations of 4,283 data center facilities across the contiguous United States. 97.5% of the facilities were located within a metropolitan or micropolitan statistical area, and in a city-level statistical model, the rated capacity of local power plants showed the strongest association with siting. IT-related employment, fiber-optic quality, and the presence of retired coal-fired power plants followed in that order.
The findings revise the common image of data centers as large structures built on cheap, wide-open rural land. Even when a building sits far from a downtown core, it often remains within a metropolitan area that shares transmission infrastructure, communication networks, and a labor market with the urban center. As data centers' power demand is projected to keep growing, the physical infrastructure of the cloud is becoming deeply embedded in the power planning of existing cities.
"97.5%" and Dense Urban Footprints Are Different Boundaries
The metropolitan statistical area and micropolitan statistical area used in the paper are neither administrative city boundaries nor continuous built-up urban footprints. They are statistical regions defined by the U.S. Office of Management and Budget, built from counties as the base unit. A metropolitan area is anchored by an urban area with a population of 50,000 or more; a micropolitan area is anchored by one with a population between 10,000 and 50,000. Both include surrounding counties with strong commuting ties to the core.
Under this broad boundary, 97.5% of the 4,283 facilities fall within a metropolitan or micropolitan area. By contrast, only 73.5% of facilities were located within the Census urban area boundary drawn by the U.S. Census Bureau based on housing density and similar criteria. A Census urban area is defined by connecting dense Census blocks and requires at least 2,000 housing units or a population of 5,000.
| Position relative to Census urban area | Share of all facilities |
|---|---|
| Inside the boundary | 73.5% |
| Within 5 km of the boundary | 92.9% |
| Within 10 km of the boundary | 95.1% |
| Within 20 km of the boundary | 97.5% |
The average distance from a facility to the nearest urban area boundary was 5.9 km, with a median of 1.26 km. In other words, what the paper found is less "concentration in city centers" and more "concentration inside and near built-up urban areas." Using the 97.5% figure—which counts entire, often vast counties as part of a metropolitan area—alongside the 73.5% figure that reflects dense urban footprints reveals the connection between suburban-style campuses and urban infrastructure.
There is also significant clustering in concentration. The Washington–Arlington–Alexandria metropolitan area alone hosts 610 facilities, accounting for 14.2% of the total. It is followed by the Chicago metro area with 241 facilities, Dallas–Fort Worth with 192, New York with 163, and Phoenix with 154 — together, the top five metropolitan areas account for roughly one-third of all facilities. The scale of the largest markets shows that the cloud is not an evenly distributed network but a structure built around a small number of metropolitan areas serving as major hub nodes.
The Coefficient for Power Generation Capacity Outweighs IT Talent and Fiber Optics
Because facility counts are zero-inflated count data, the research team used negative binomial regression across 910 metropolitan areas. After standardizing each explanatory variable for comparison, the coefficient for local power plant rated capacity was the largest at 1.324. IT-related employment came in at 0.719, fiber-optic quality at 0.444, and the presence of retired coal-fired power plants at 0.162 — all showing positive associations. Natural disaster risk showed a coefficient of -0.476.
Rated capacity represents the maximum output of power generation equipment. It is not a direct measurement of the actual electricity flowing to data centers, nor of remaining spare capacity on transmission lines. Even so, the relationship — that regions accustomed to handling large volumes of electricity tend to host more facilities — proved stronger than explanations based solely on urban population or electricity prices. Water stress, electricity price volatility, and grid stress were not statistically significant in the primary city-level model.
In a more granular analysis broken down to 2,137 counties, power generation capacity and IT employment retained significant positive associations. The same held for fiber-optic quality and the presence of retired coal-fired power plants. However, grid stress and electricity price volatility shifted to significant negative associations in the county-level model, while natural disaster risk and state tax incentives lost significance. Because some results shift depending on the granularity of the geography observed, the coefficients cannot be treated as a nationally uniform siting rule.
The paper also conducted causal structure discovery using the PC algorithm. Direct pathways to facility counts extended from power generation capacity and IT employment, with fiber-optic quality and retired coal-fired power plants also entering the same structure. However, this analysis does not incorporate temporal ordering, nor does it estimate the magnitude of causal effects. It is not a result derived from tracing corporate internal approval processes or grid interconnection applications that determined siting decisions, but rather a structural hypothesis consistent with the conditional independence relationships among the variables.
Overlap Between Former Fossil-Fuel Regions and Facilities Under Development
The overlap with former fossil-fuel regions is more pronounced among facilities still in the development stage. Of the 4,177 facilities for which operational status could be confirmed, 1,221 were under development and 2,956 were operational. The share falling within a "Coal Closure Energy Community" — designated due to a coal mine closure or the retirement of a coal-fired power plant — was 6.47% (79 facilities) among those under development, compared with 3.04% (90 facilities) among operational ones. The share among facilities under development is roughly 2.13 times higher.
The Energy Community designation referenced here is a geographic classification established under the 2022 Inflation Reduction Act to provide bonus tax credits for eligible clean energy projects. The Coal Closure category applies to census tracts where a coal mine closed after the end of 1999, or where a coal-fired generating unit was retired after the end of 2009, along with their adjacent tracts. It is not the name of a subsidy directly aimed at data center construction; the researchers use it as geographic data to identify former fossil-fuel regions.
Overlap with an Energy Community does not by itself show that a data center is built on the same site as a retired power plant, or that it actually makes use of remaining equipment there. That said, the Pacific Northwest National Laboratory (PNNL), under the U.S. Department of Energy, has noted that grid interconnection equipment, administrative buildings, and parking lots at retired power plant sites can potentially be reused, and has cited such sites as candidates for connecting new clean power sources to meet data center demand. This is one plausible pathway that could explain the geographic association found in the paper, but it has not been verified as the actual mechanism at individual facilities.
Overlap with retired coal-fired power plants cannot be taken as evidence of a preference for active coal power. In supplementary analysis, no meaningful association was found between a state's share of coal in electricity generation or its share of renewable energy, and data center activity or capacity. The findings are more consistent with an explanation rooted in path dependency — where grid interconnections and industrial land persist over long periods — than with fuel-type preference.
The Cloud Returns to Urban Power Planning
According to estimates updated by Lawrence Berkeley National Laboratory (LBNL) in June 2026, U.S. data center electricity consumption in 2030 is projected to reach 649 TWh in the base case, or 11.8% of total national consumption. Accounting for uncertainties such as equipment shipments and cooling performance, the range widens to 521–843 TWh, or 9.5–15.3%. While this demand is not yet fixed, if siting continues to concentrate within a small number of metropolitan areas, regional power generation and transmission constraints could surface before the national aggregate becomes a pressing issue.
The paper also examined the relationship between population and facility count for 319 cities with at least one facility as of 2025. The scaling exponent was 0.746, with a 95% confidence interval of 0.672–0.820. Larger cities host more facilities in absolute terms but fewer per capita. Even in 2050 projections using four different population scenarios, the existing urban hierarchy was maintained. However, this is merely a statistical projection extrapolated from population data alone, not a forecast that accounts for individual construction plans, grid interconnections, or power policy.
The facility list underlying the research comes from the commercial DataCenterMap, and the complete raw data has not been made public. The authors have published processed data and code on GitHub to allow the analysis to be reproduced, but facility capacity data contains gaps, and actual power purchase agreements or available interconnection capacity are not covered. Given this limitation, what should be examined next is not the total announced MW of facilities, but the progress of grid interconnection agreements, the conversion rate from under-development to operational status, and the breakdown of power sourced from former fossil-fuel plant sites.
The geography of the cloud follows not the distribution of land suitable for servers, but the history of electricity, communications, and employment that cities have built up over time. If the overlap between former fossil-fuel regions and facilities under development continues, data center policy will need to address corporate site-selection incentives and power generation, transmission, and ratepayer burden issues on the same map.